1449
SharkTankOnyxChallenge_Tsegbemi
SharkTankOnyxChallenge_Tsegbemi
Report Author: Tsegbemi Ayonronmi
1449
Share template with others
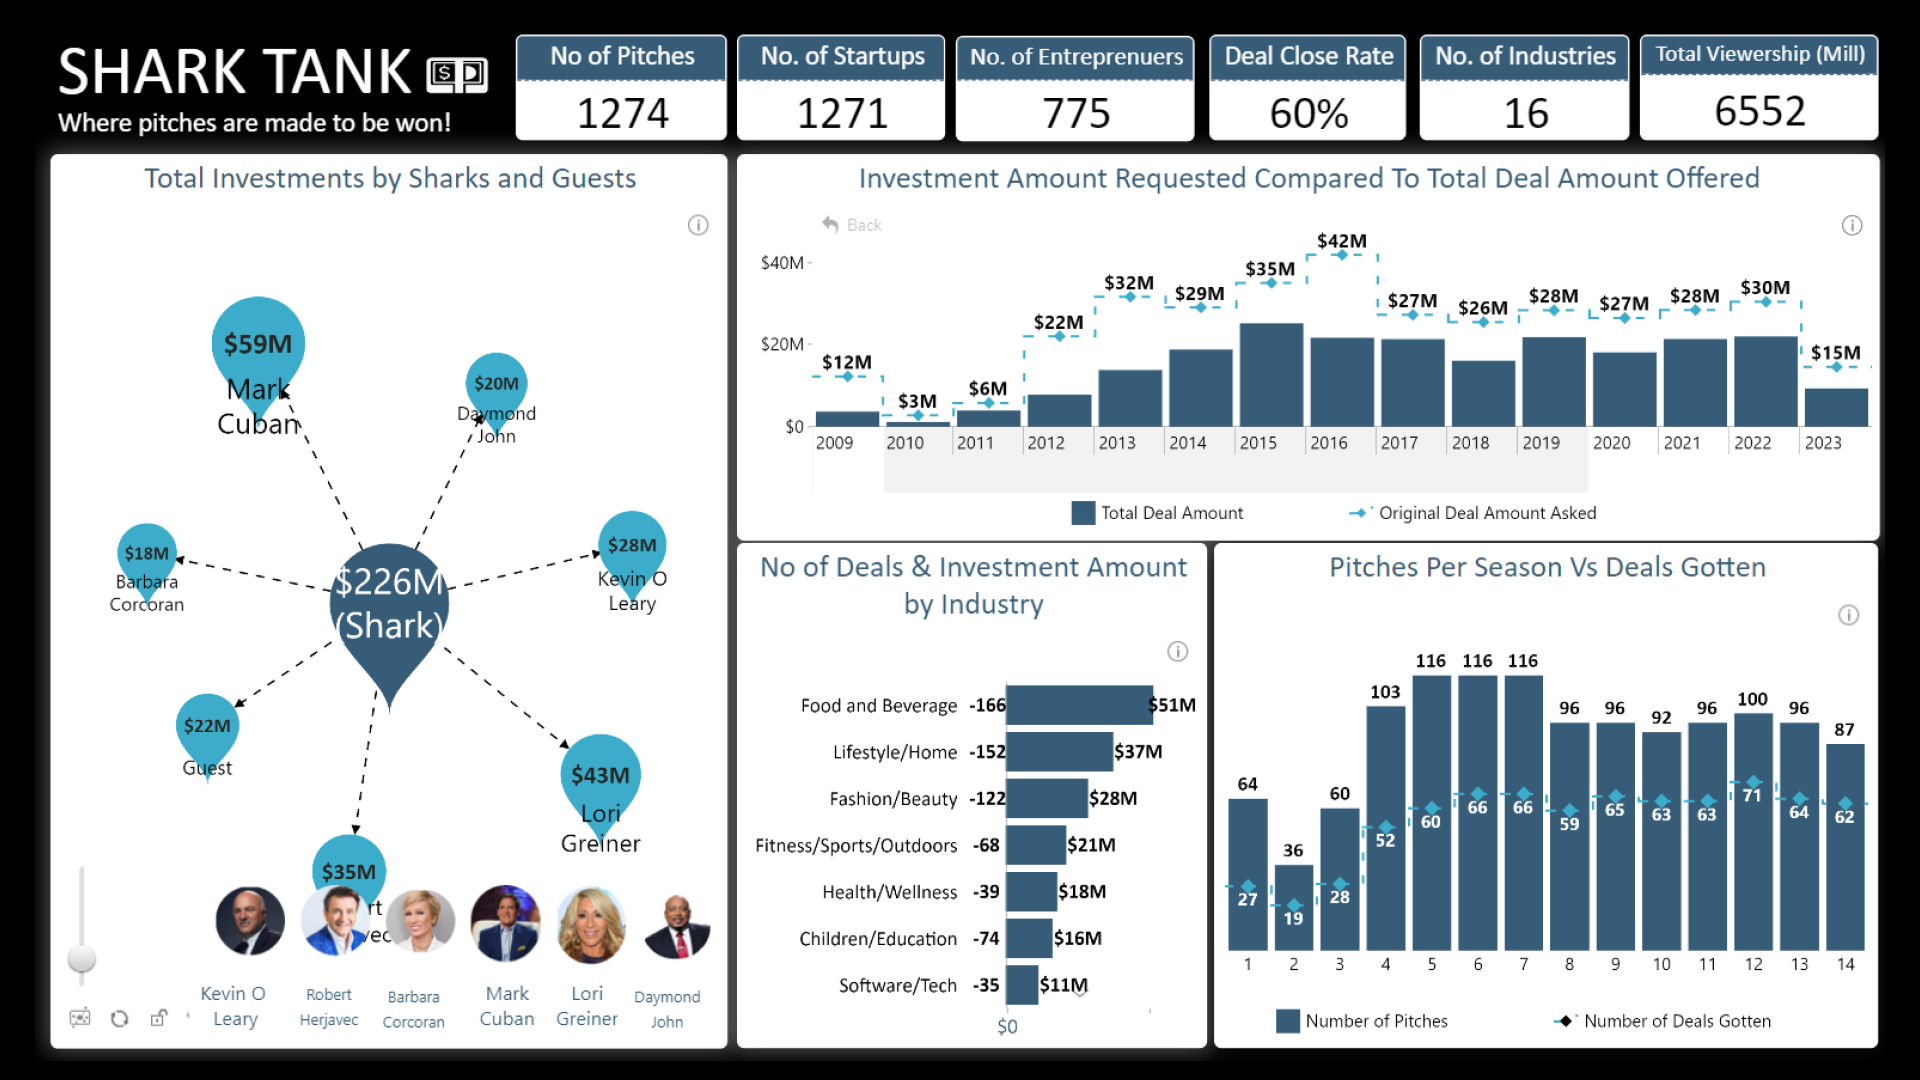
Report submitted for Onyx Data DataDNA ZoomCharts Mini Challenge, September 2023. The report was built based on Shark Tank US dataset and includes ZoomCharts custom Drill Down PRO visuals for Power BI.
Author's description:
The report is a one page summary which focuses on the pitches that startups/entrepreneurs make in Shark Tank. The card visuals capture the overview of the number of pitches, no of start ups, number of enterprenuer, total viewship of the show in the US and the deal close rate. A drill network pro was used to highlight the total amount invested by sharks in the pitches made and how much each shark has invested. The drill down timeline Pro was used to breakdown the trend of how much was asked by the pitchers and how much was invested by the sharks. The drill down combo pro was used to highlight how many pitches were made per season and how many successfully closed the deal. The drill down combo bar was used to highlight how much was invested into each industry and the distribution of deals by the industry.
ZoomCharts visuals used




4U Report Challenges
Participate in data challenges, build and submit reports to get free template downloads.
Join CommunityMobile view allows you to interact with the report. To Download the template please switch to desktop view.
How to use a PBIX template
Preview the interactive report, download the PBIX file, open it in Power BI Desktop, and replace the same data connection with your own dataset.
Preview and download
Explore the report online and download the PBIX template file.
Open in Power BI Desktop
Open the downloaded PBIX file in Power BI Desktop.
Connect your data
Replace the sample data source with your own dataset.
Refresh and adjust
Refresh the model and update fields or visual were needed.
Save and share
Save your report and publish it for your audience.


