1221
Power BI Sales Pipeline Dashboard Template
Power BI Sales Pipeline Dashboard Template
More Report pages
Report Author: Aakash M
1221
Share template with others
Summary
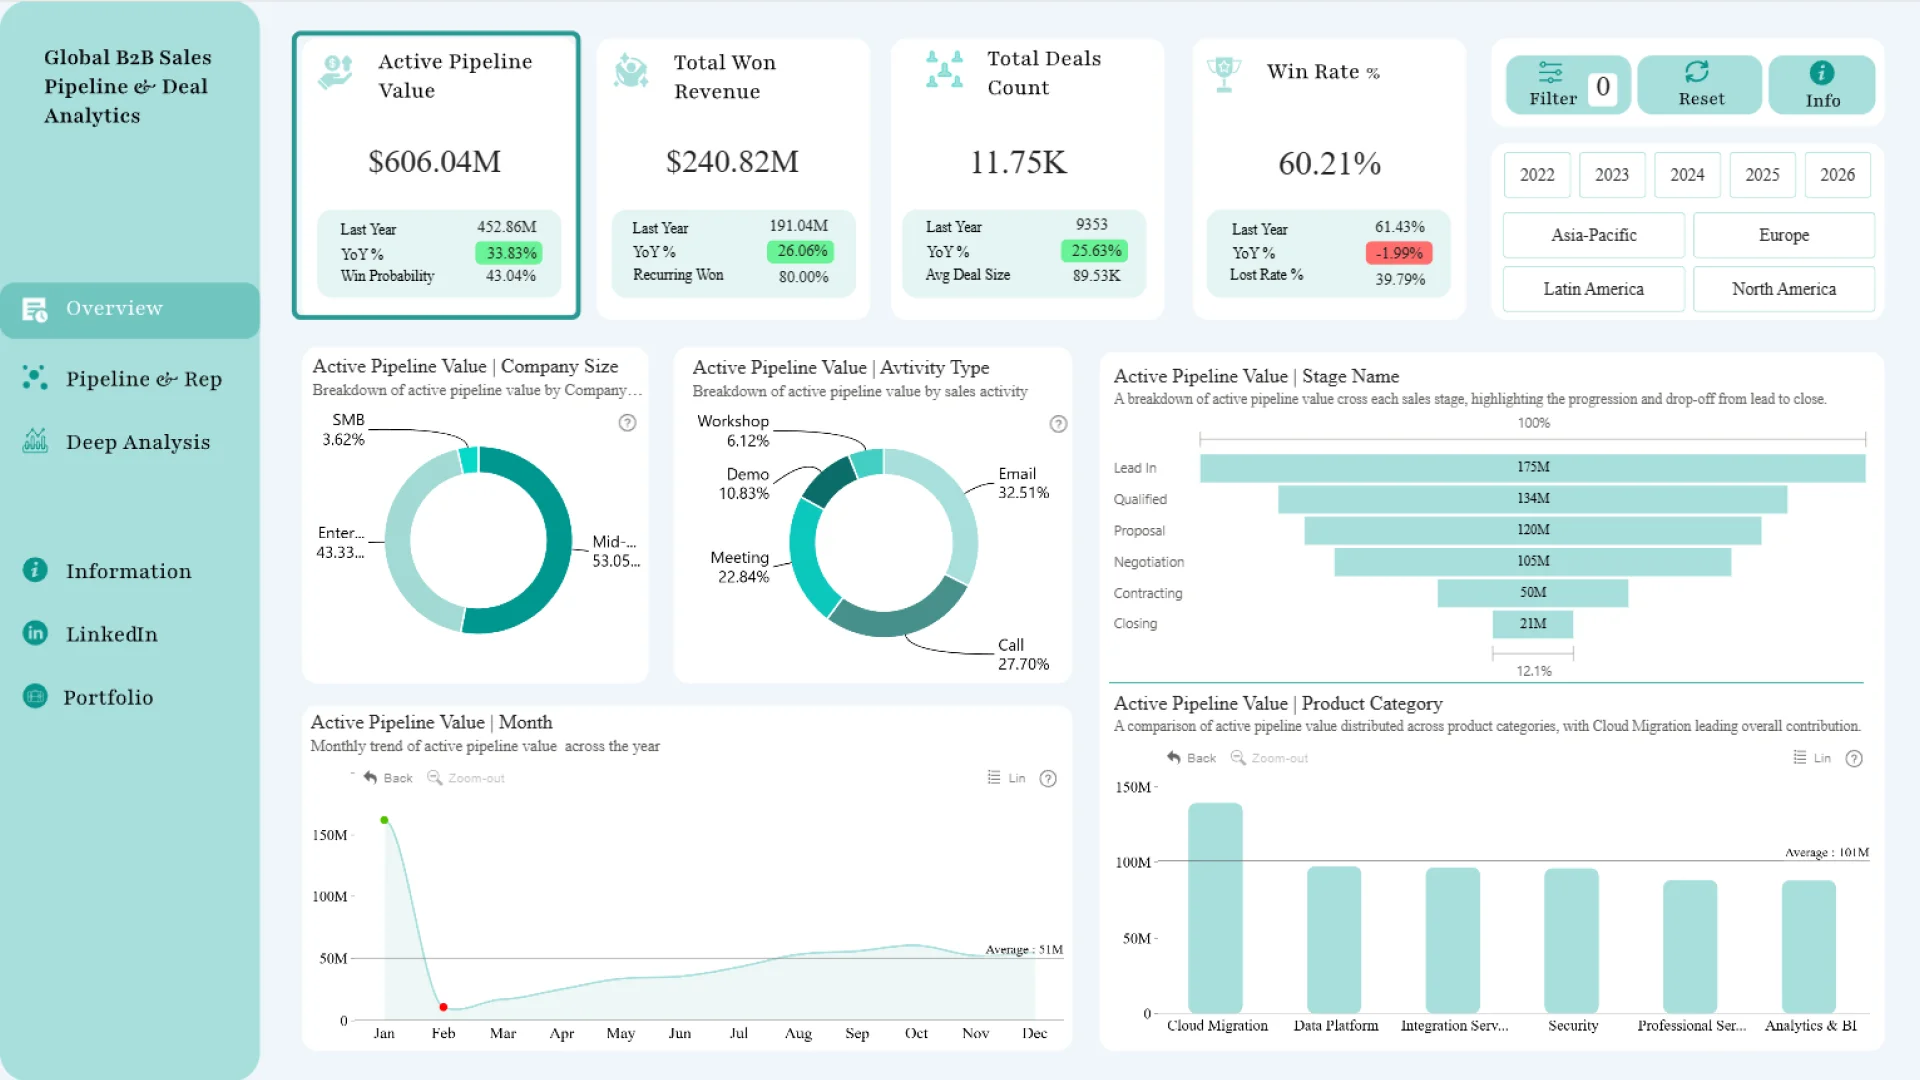
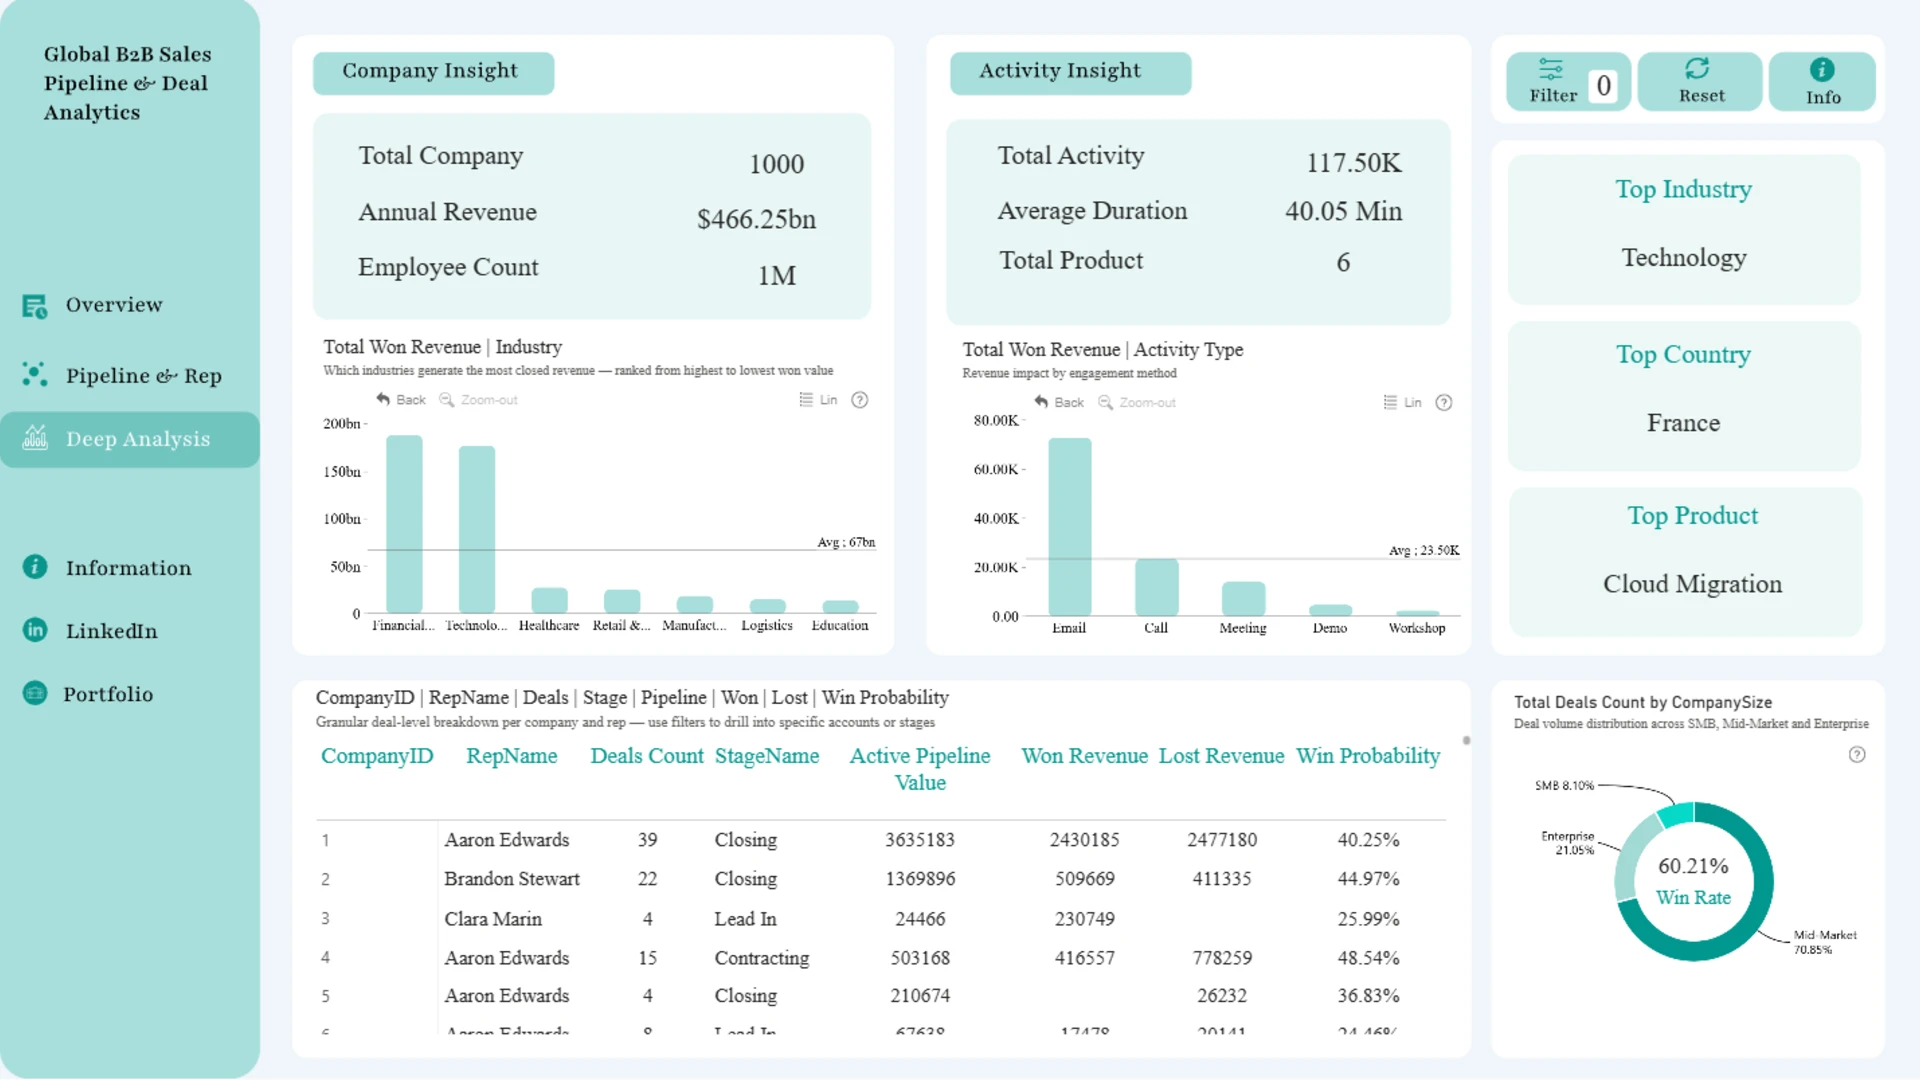
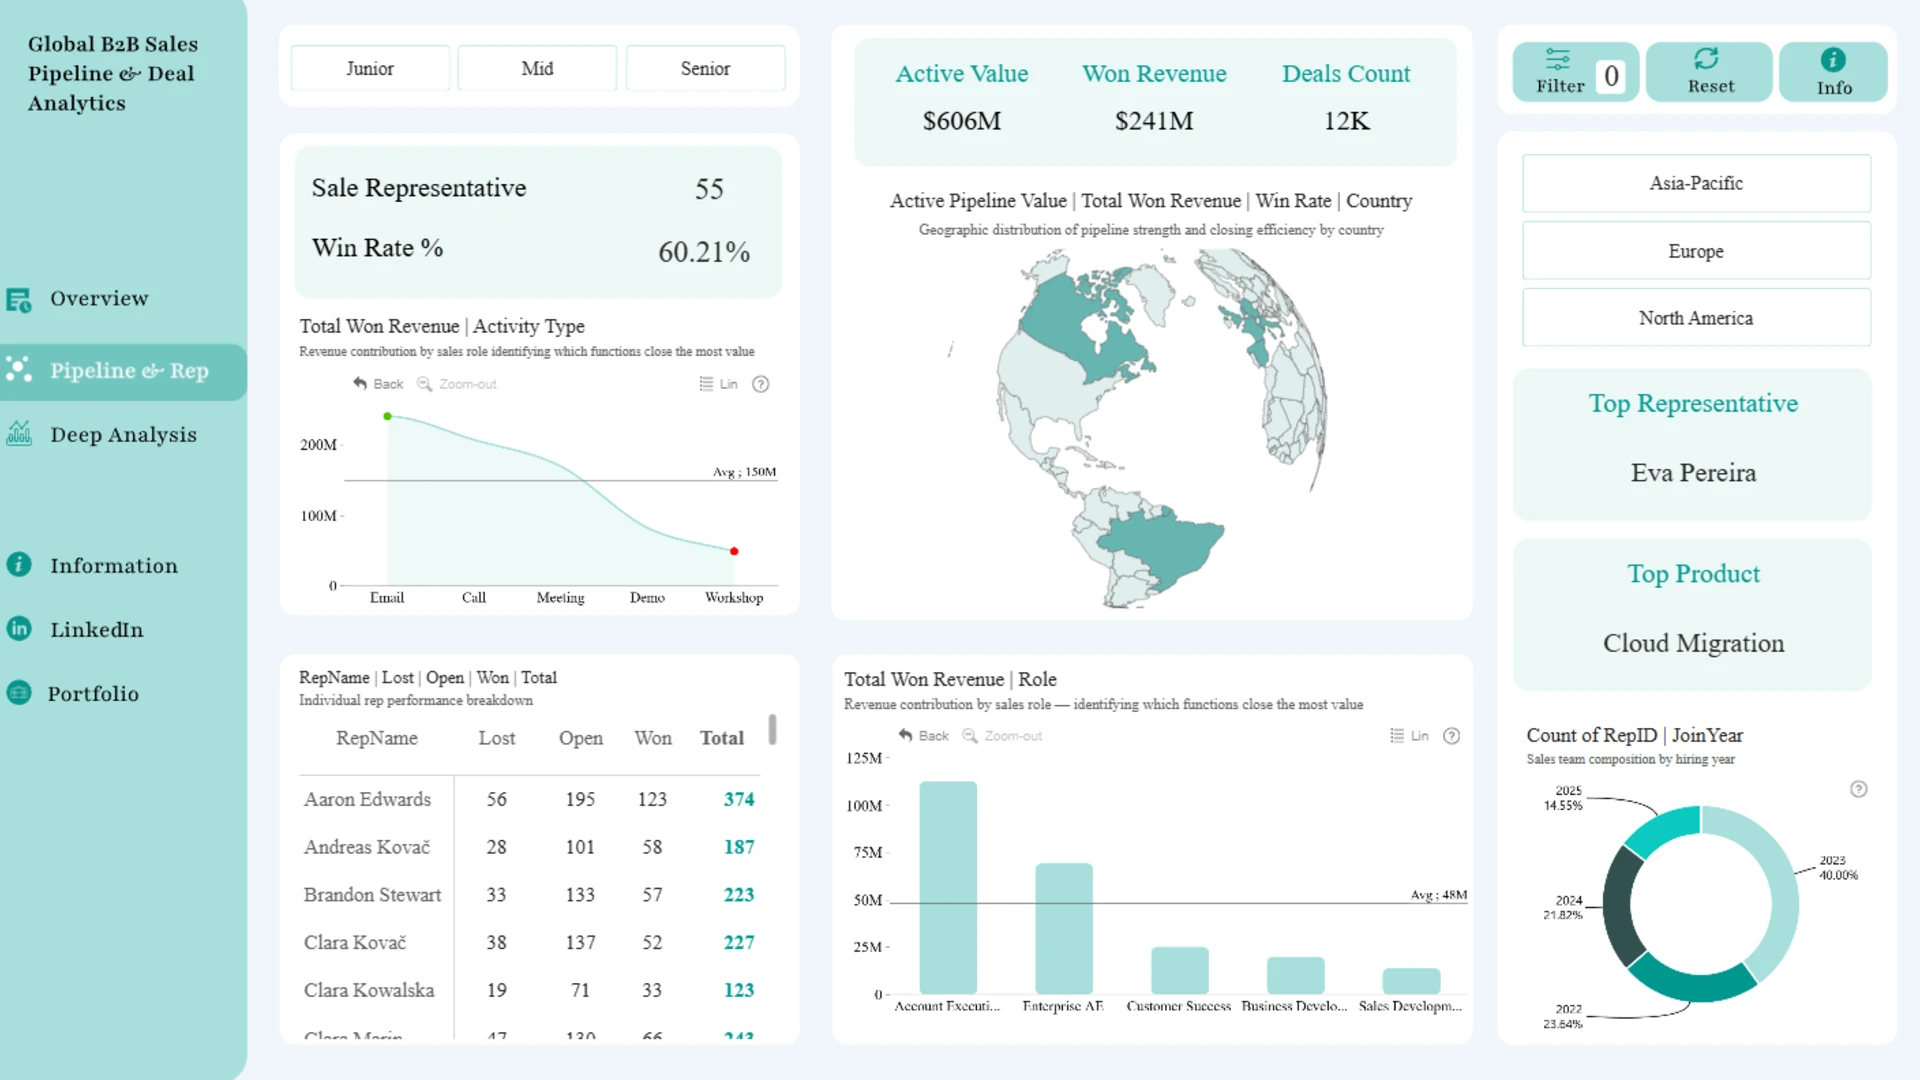
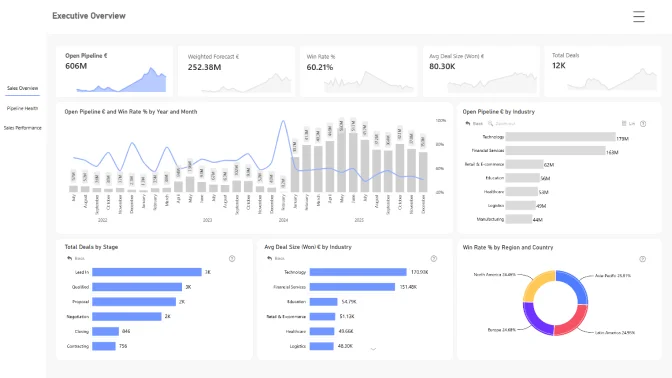
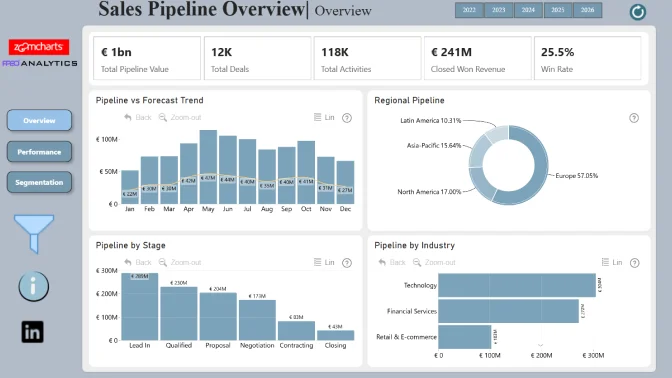
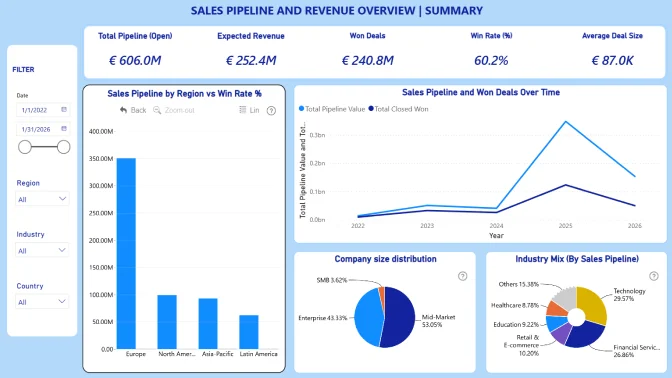
Explore a Power BI sales pipeline report for tracking active pipeline value, won revenue, deal count, win rate, sales rep performance, activity type, industry performance, and regional B2B deal trends. This report helps sales teams monitor pipeline health, compare representative and company-level performance, and identify where deals are progressing, stalling, or creating the most revenue opportunity.
This interactive Power BI report explores the Global B2B Sales Pipeline & Deals Analytics dataset. The report was submitted to the FP20 Analytics ZoomCharts Data Challenge #35 (February – March 2026).
4U Report Challenges
Participate in data challenges, build and submit reports to get free template downloads.
Join CommunityMobile view allows you to interact with the report. To Download the template please switch to desktop view.
Was this helpful? Thank you for your feedback!
Sorry about that.
How can we improve it?