826
Sales & CRM Insights Report
Sales & CRM Insights Report
More Report pages
Report Author: Norman Reynaldo Sabillon Castro
826
Share template with others
Report submitted for FP20 Analytics ZoomCharts Challenge 17 (July 2024). The report was built with the CRM & Sales Pipeline Analysis dataset and includes ZoomCharts custom Drill Down PRO visuals for Power BI.
Author's description:
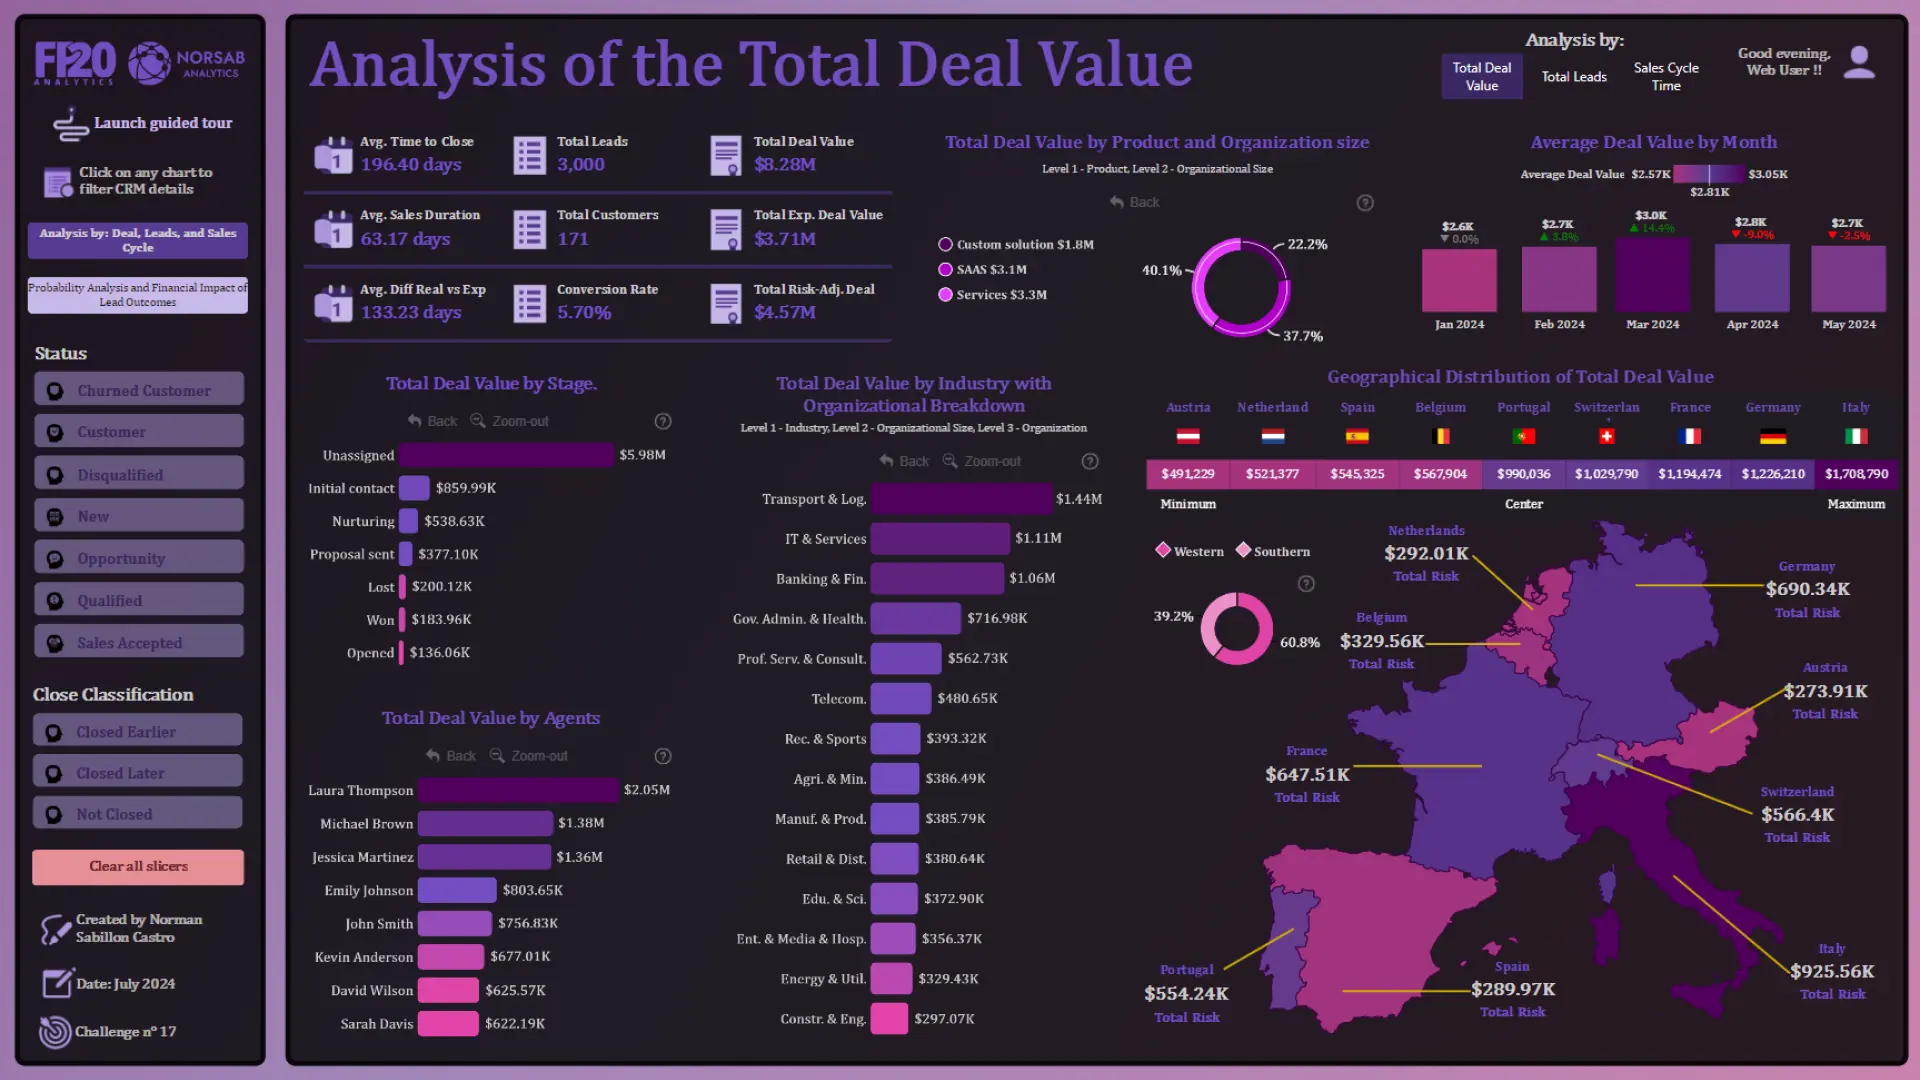
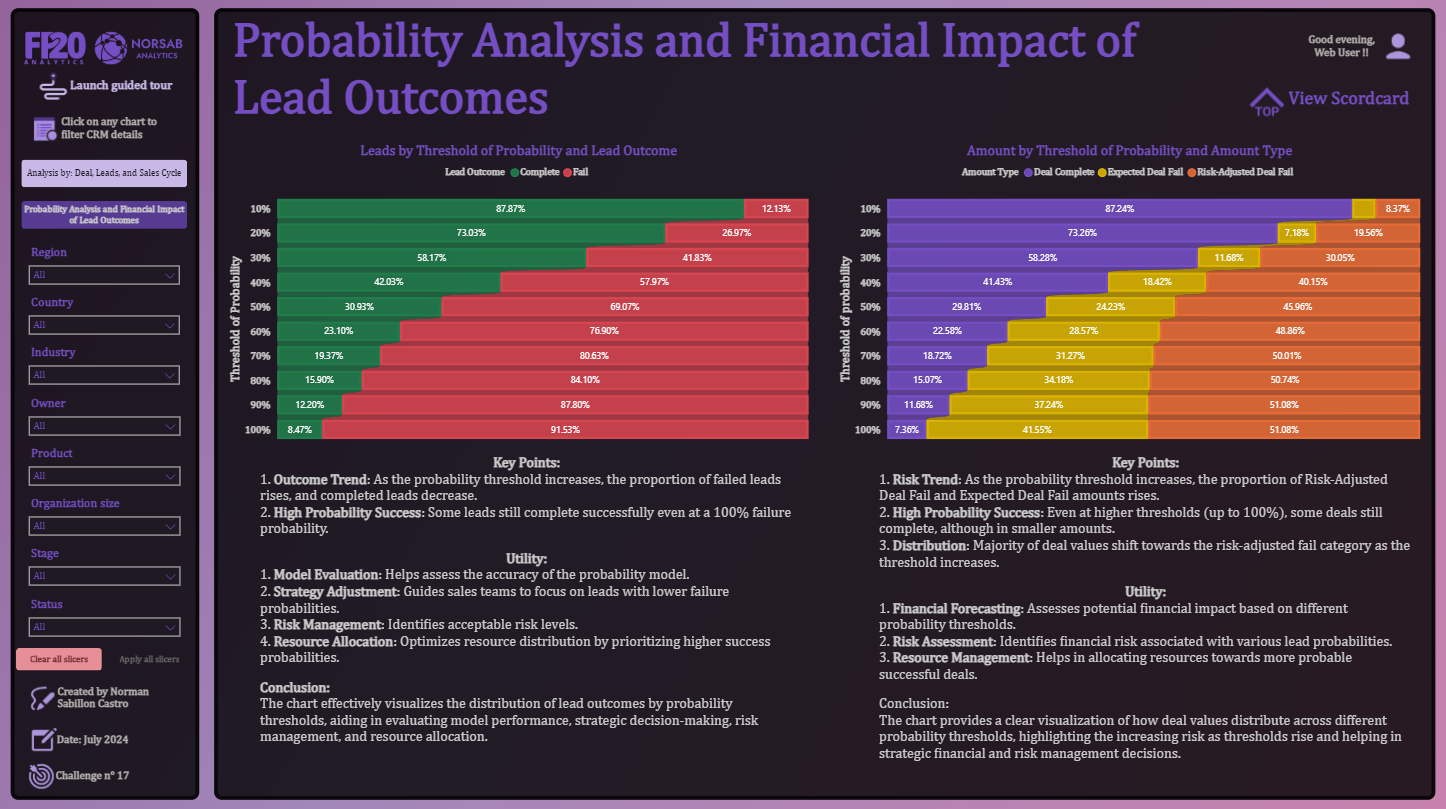
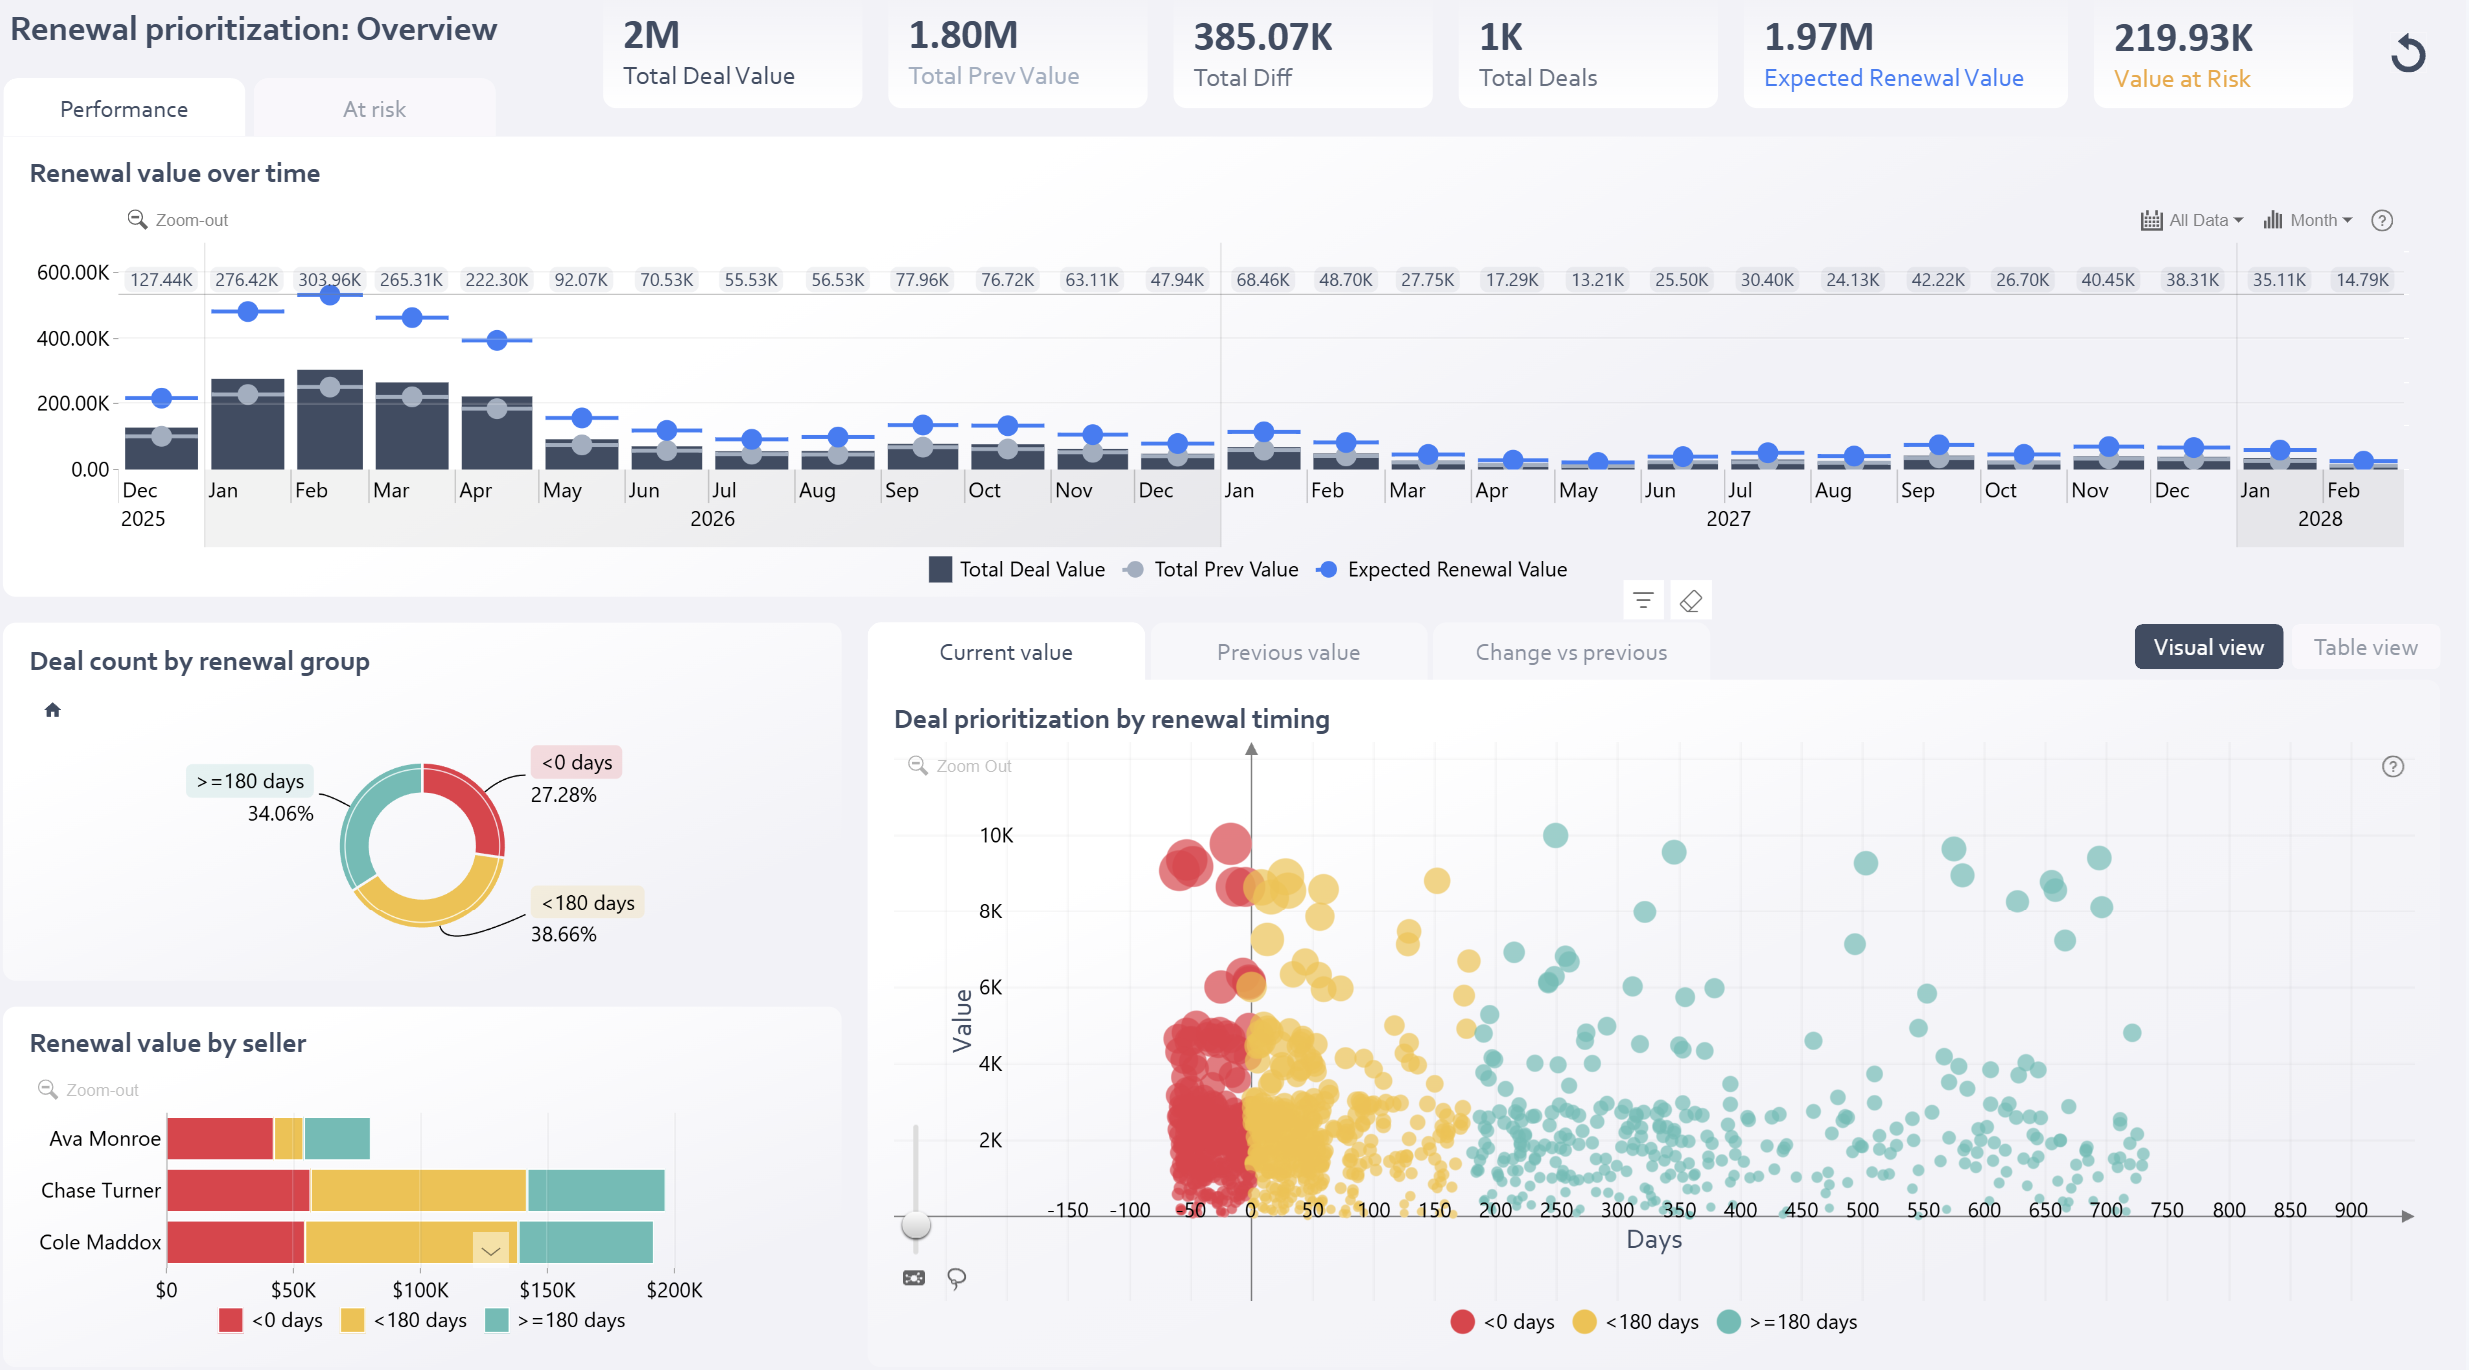
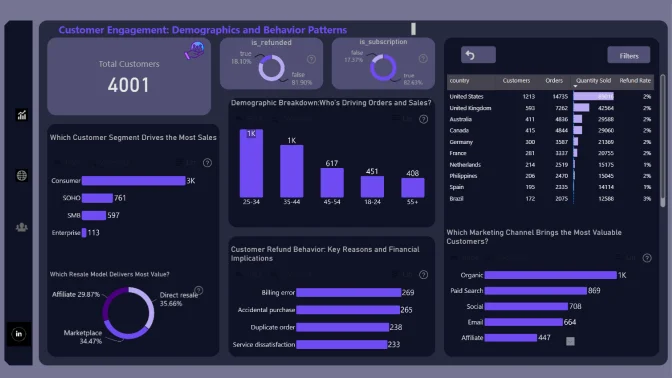
I have created the Sales & CRM Insights Report, a comprehensive dashboard that provides detailed information on CRM and sales pipeline data. This report allows users to explore key metrics and trends across multiple dimensions, such as lead distribution, sales performance and pipeline status. It includes interactive visualisations to track total deal value, total leads, conversion rates and more. The dashboard includes detailed maps to visualise total deal value, total leads, conversion rates and sales cycle time in different countries. Use the guided tour to effortlessly navigate through the dashboard and drill down into the data. This tool is designed to help companies make data-driven decisions and optimize their CRM strategies and sales process management effectively.
4U Report Challenges
Participate in data challenges, build and submit reports to get free template downloads.
Join CommunityMobile view allows you to interact with the report. To Download the template please switch to desktop view.

Was this helpful? Thank you for your feedback!
Sorry about that.
How can we improve it?