78975
Sales Conversion Analytics Power BI Dashboard
Sales Conversion Analytics Power BI Dashboard
More Report pages
Report Author: ZoomCharts
78975
Share template with others
Summary
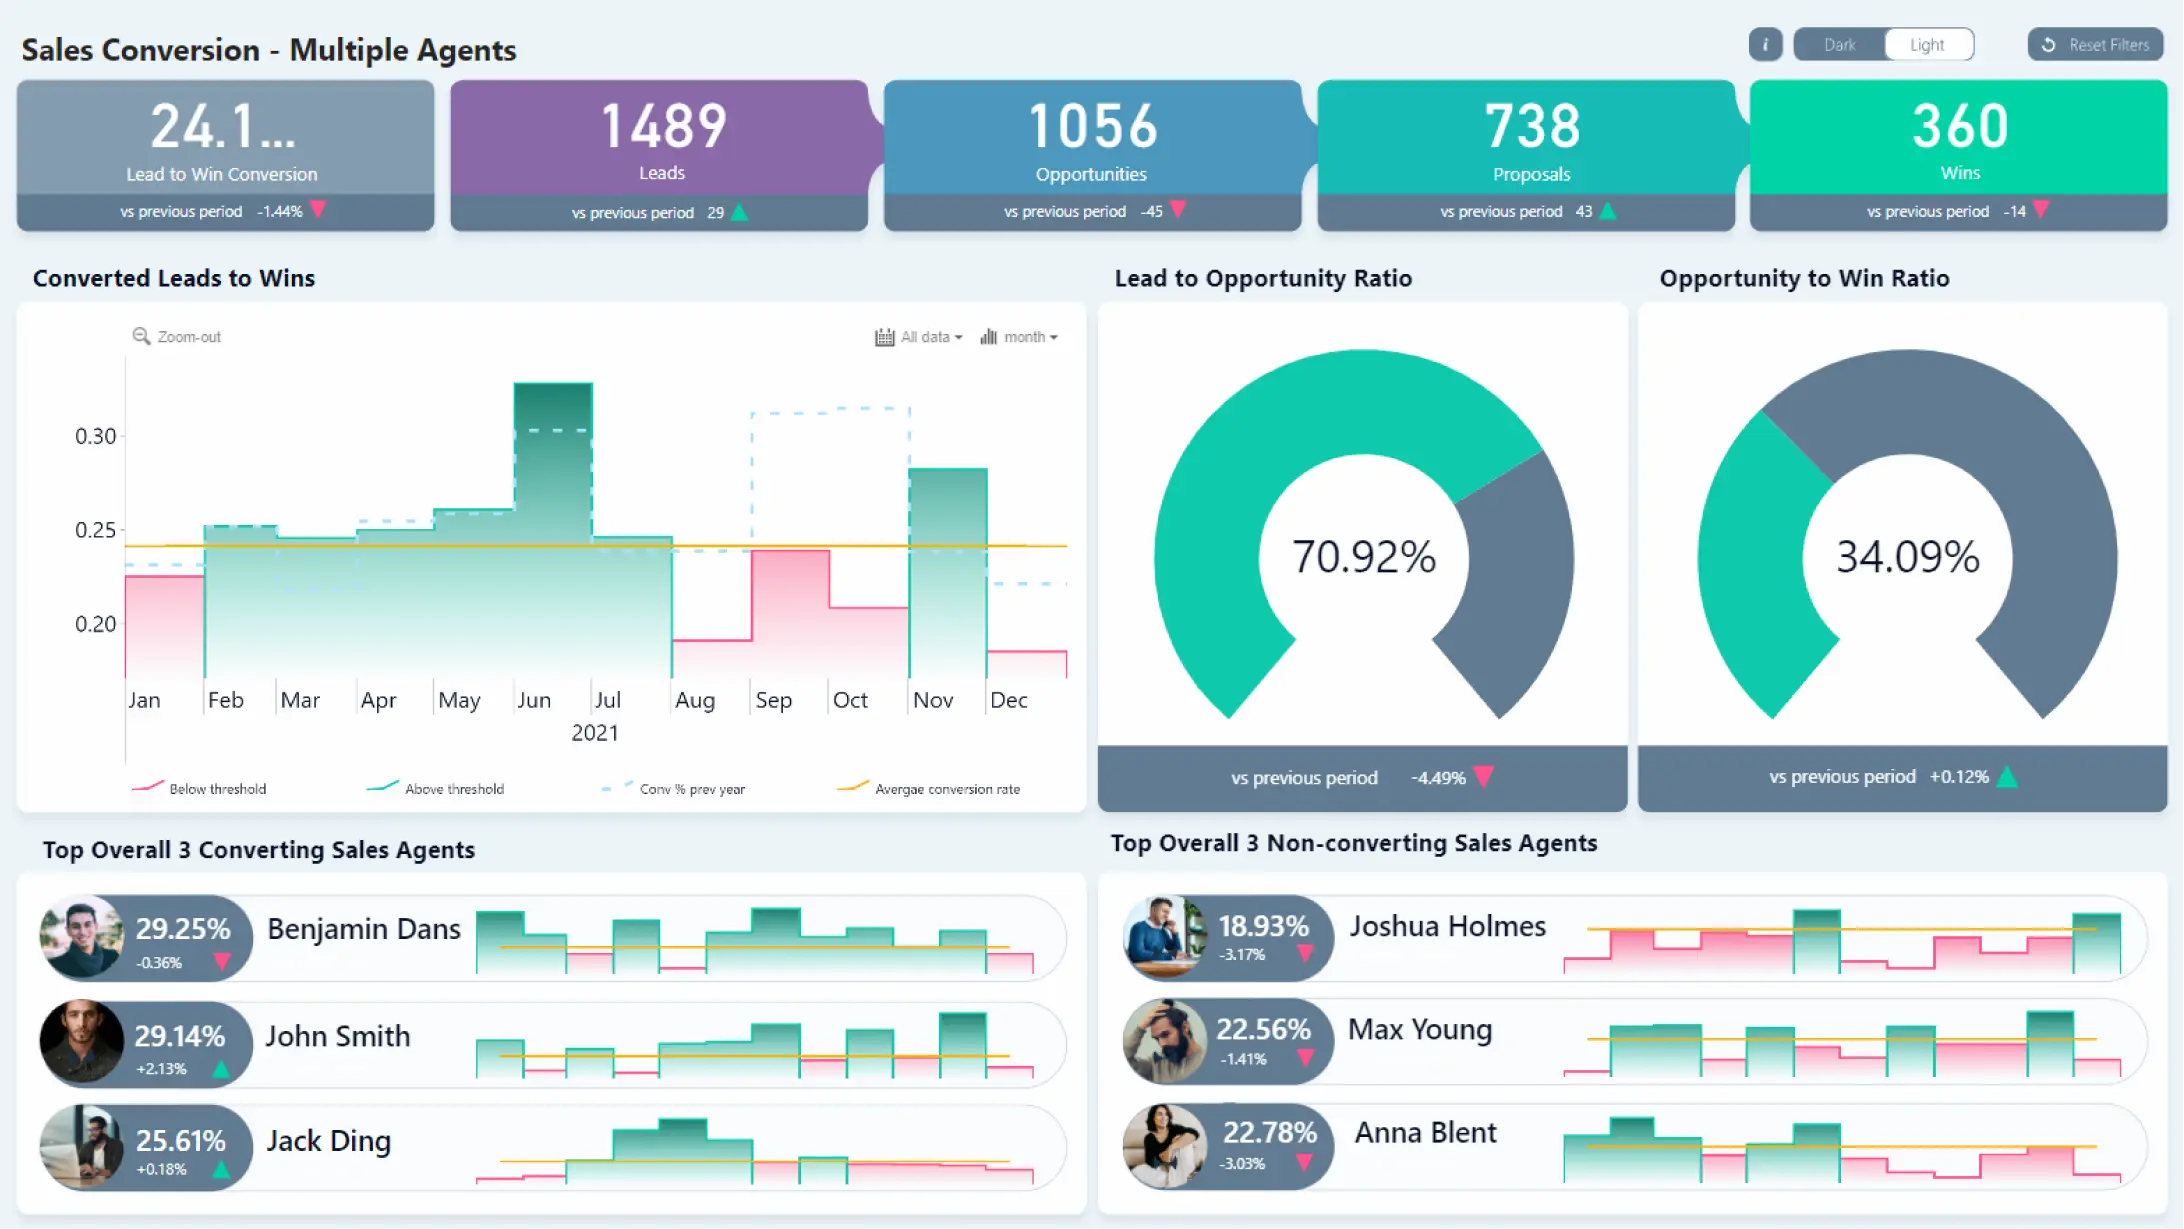
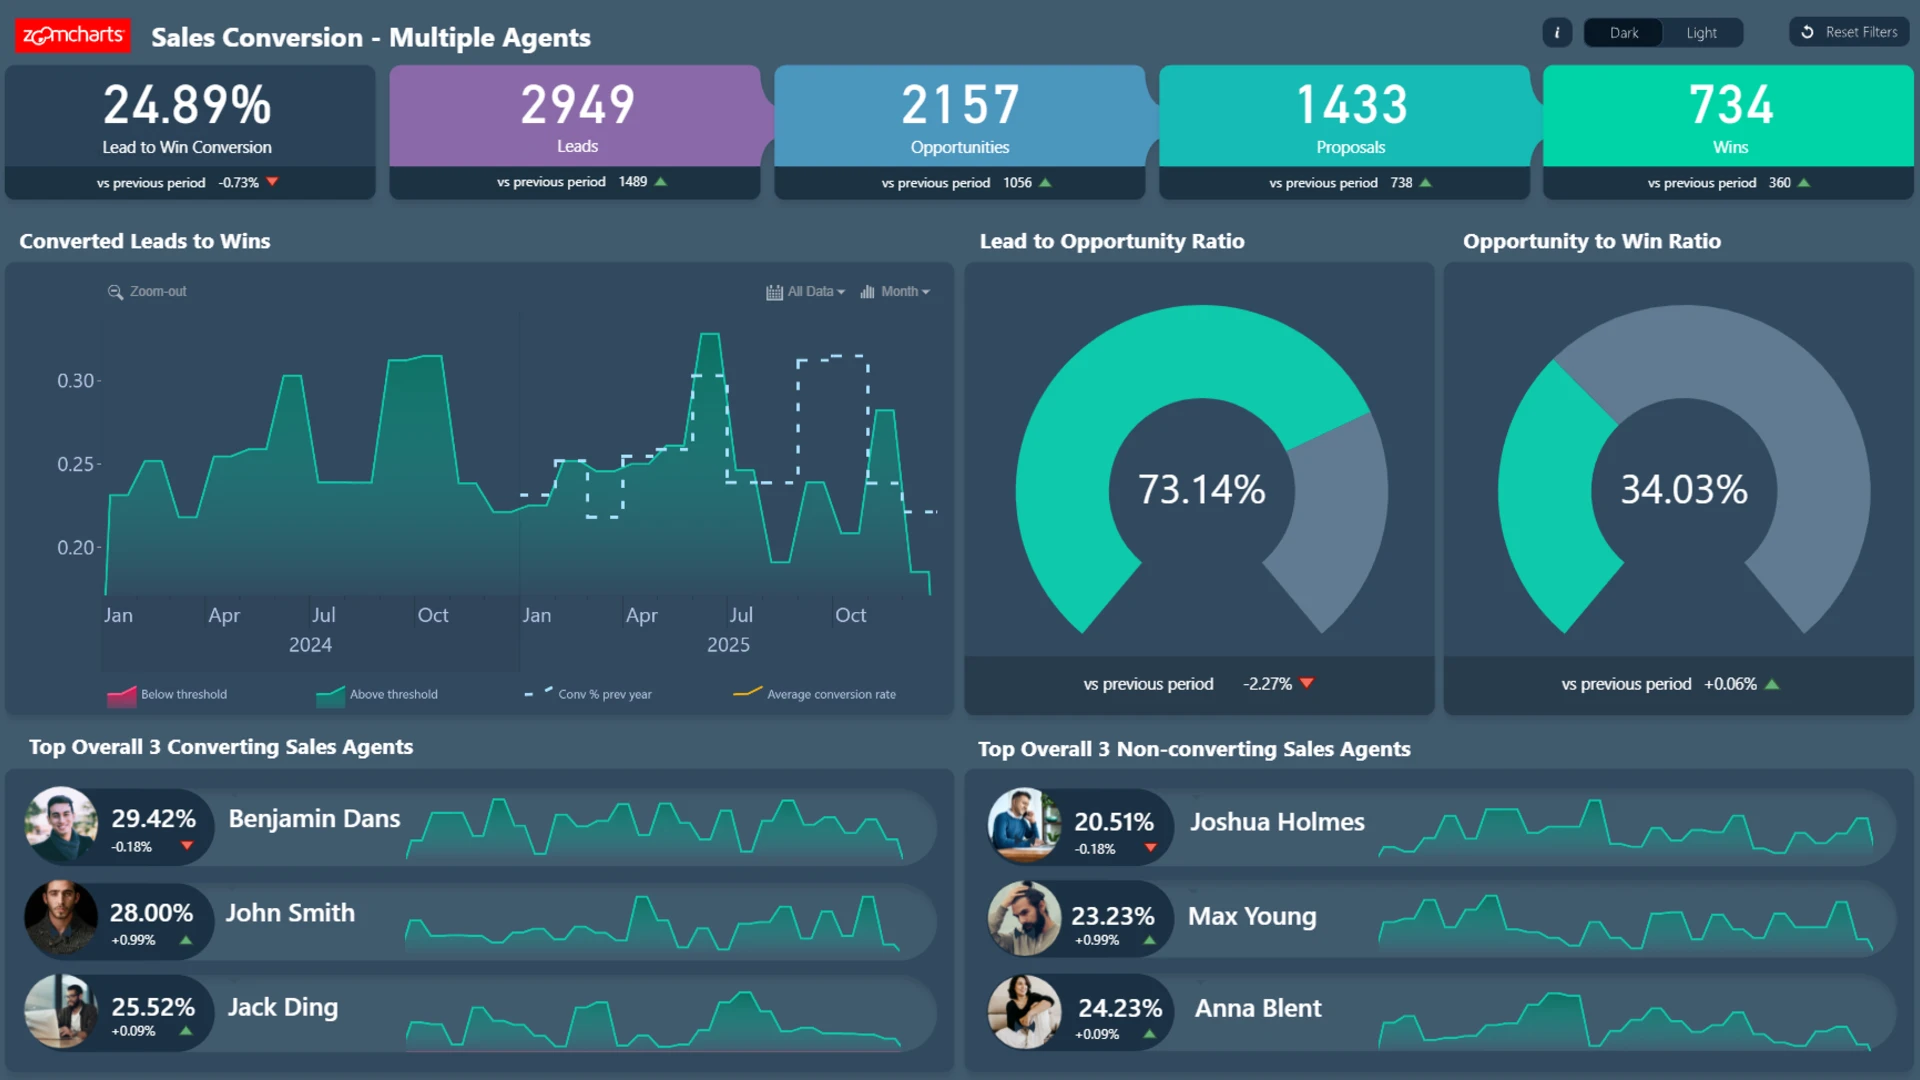
This Power BI sales funnel and conversion dashboard example provides a clear view of conversion performance across the sales process. It helps users understand how effectively sales activity turns into results and where performance may need closer attention.
Key Insights of the Power BI Sales Funnel & Conversion Dashboard
The report is designed to support practical analysis of sales progression and conversion outcomes. Its main areas of focus include:
- Sales conversion performance: evaluate how effectively sales activity produces successful outcomes
- Funnel progression: examine movement through the sales process
- Conversion gaps: identify stages or areas that may require additional attention
- Performance comparison: compare conversion results across the dimensions available in the report
The interactive Power BI visuals make it easier to explore sales conversion data from different perspectives and focus on the information most relevant to the analysis.
How to Use This Power BI Sales Funnel & Conversion Dashboard
Select the available filters and active chart elements to narrow the report view and explore conversion performance in more detail.
Download the .pbix file, when available, to review the report setup and adapt the dashboard to your own sales data and reporting requirements.


4U Report Challenges
Participate in data challenges, build and submit reports to get free template downloads.
Join CommunityMobile view allows you to interact with the report. To Download the template please switch to desktop view.
How to use a PBIX template
Preview the interactive report, download the PBIX file, open it in Power BI Desktop, and replace the same data connection with your own dataset.
Preview and download
Explore the report online and download the PBIX template file.
Open in Power BI Desktop
Open the downloaded PBIX file in Power BI Desktop.
Connect your data
Replace the sample data source with your own dataset.
Refresh and adjust
Refresh the model and update fields or visual were needed.
Save and share
Save your report and publish it for your audience.


