75546
Sales Conversion Report
Sales Conversion Report
More Report pages
Report Author: ZoomCharts
75546
Share template with others
Summary
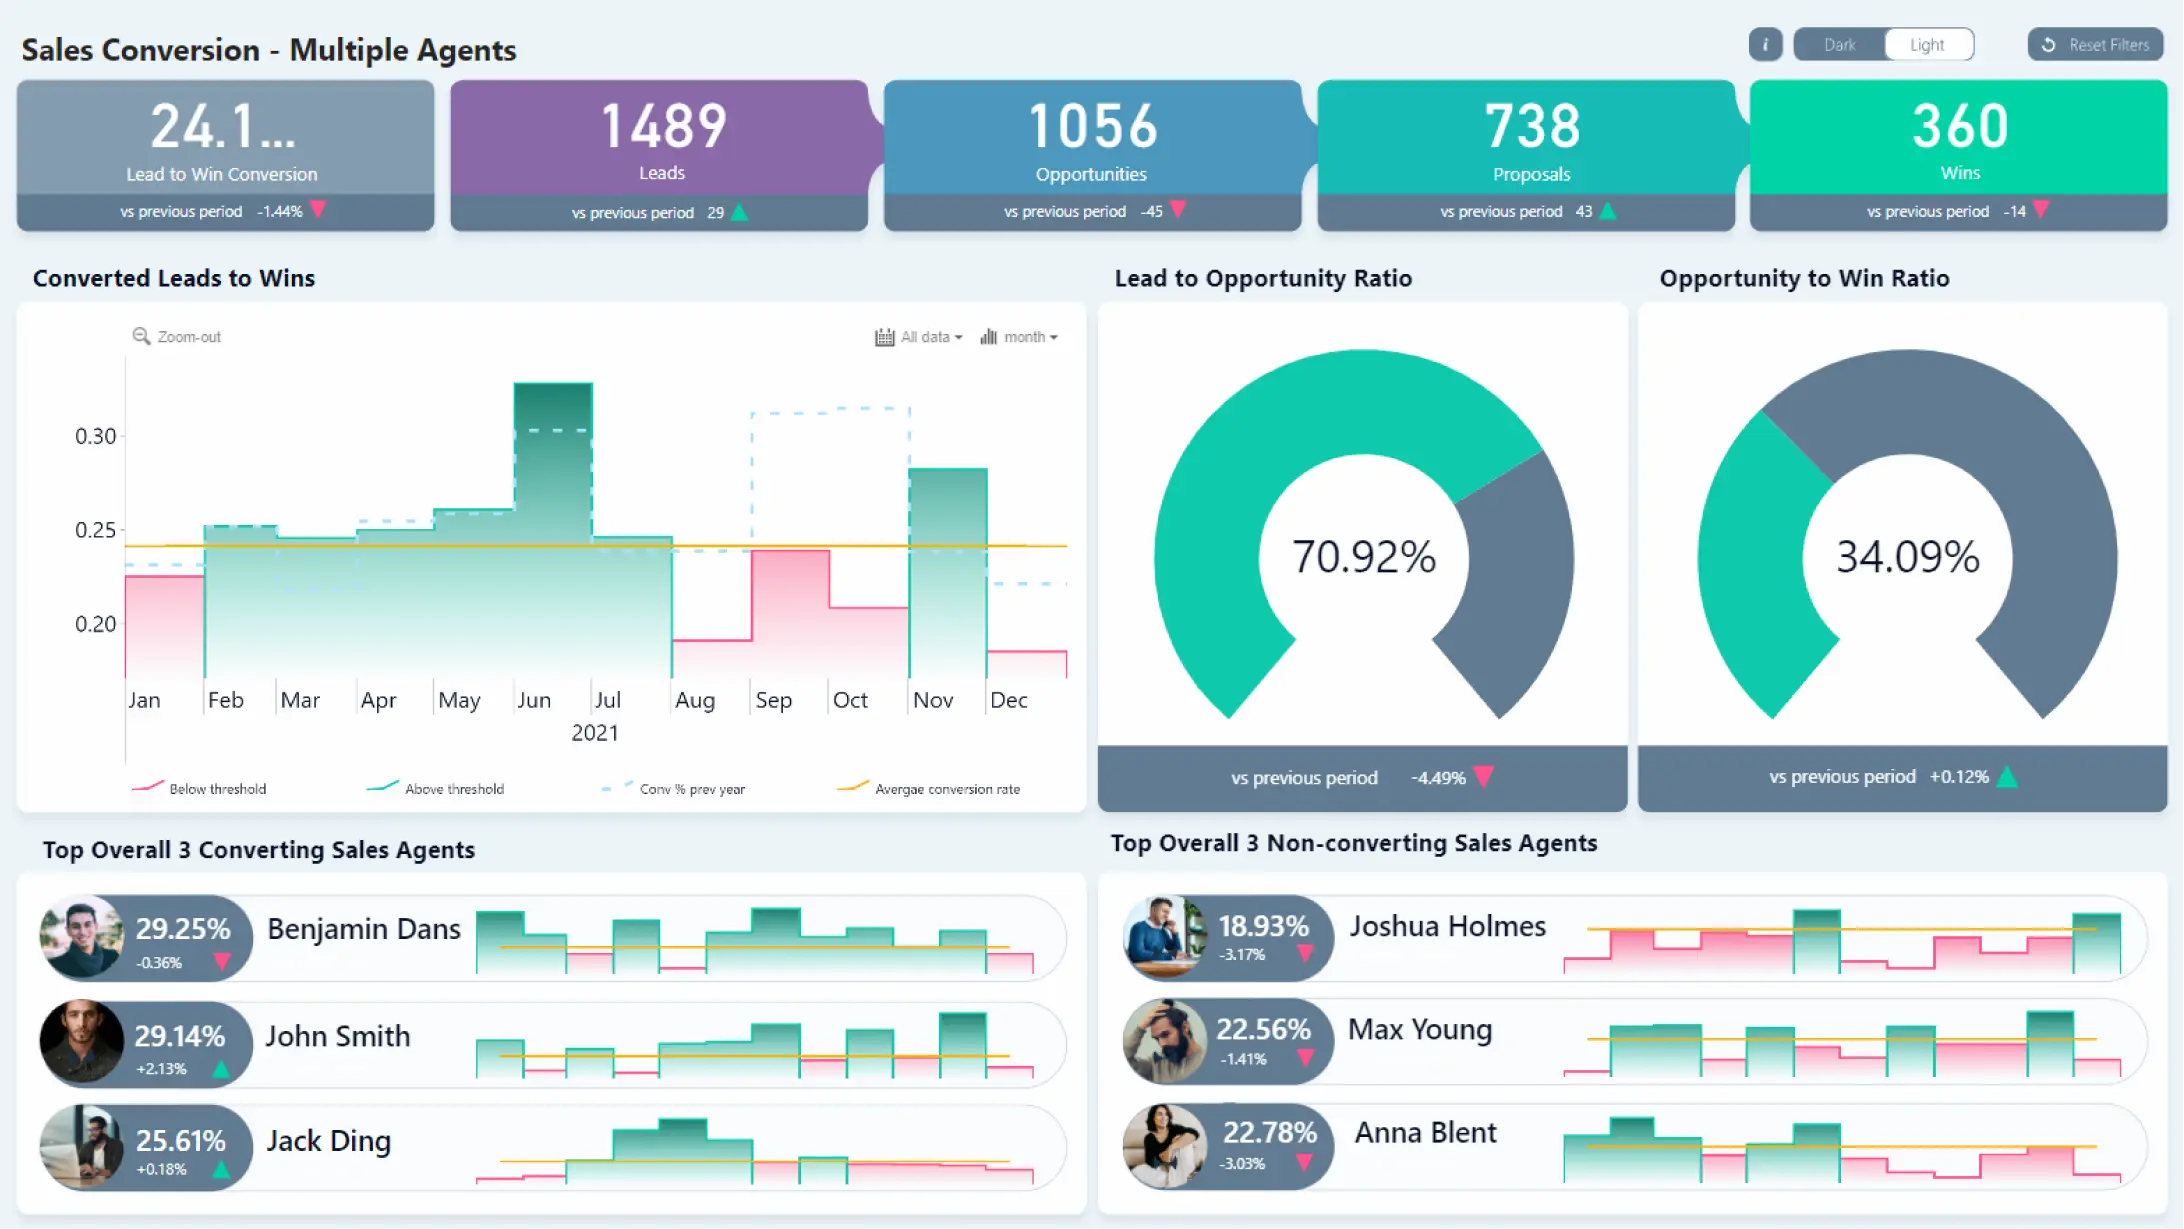
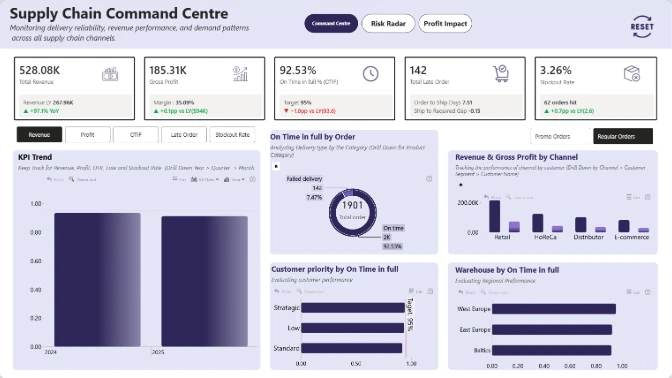
This Power BI sales analysis template is tailor-made to visualize your sales conversion data. With a quick glance, you can see the total Lead to Win conversion rate with an accompanying pipeline. Across the whole Power BI dashboard, you can see the previous year’s conversion metrics to compare increases or decreases. The core of this report is the Drill Down Timeline PRO visual that displays converted leads to wins over time.
This use case shows the average conversion rate as its threshold, and the columns are formatted based on their respective position at the threshold. The previous year’s converted percentage is shown using dash lines.
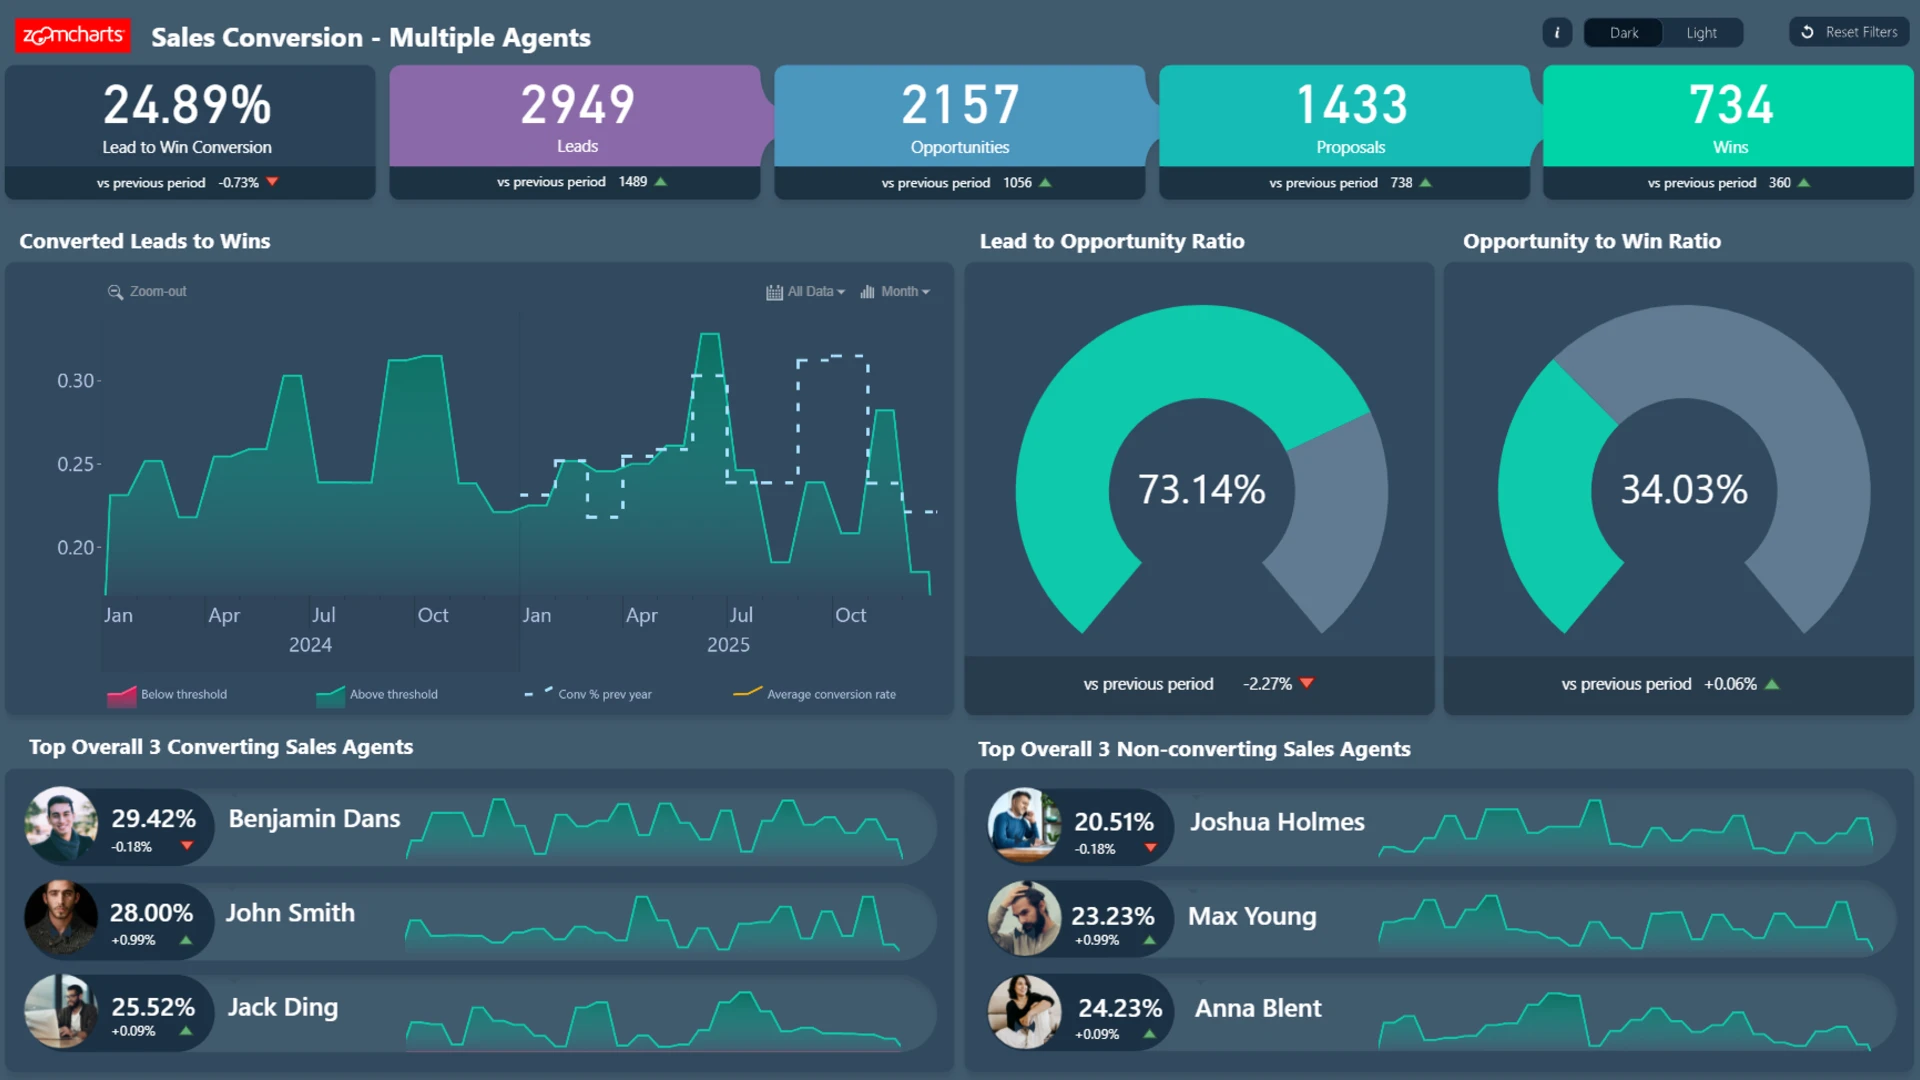
The section below uses multiple smaller instances of the timeline visual to represent each agent’s overall converted leads, ranking them accordingly. You can explore a singular agent’s timeline without affecting everything else or use the larger timeline chart to apply a time filter. To view a specific agent’s progress on the larger timeline chart, simply click on their avatar picture.
Key Features
- Drill Down Timeline PRO lets you create time-based data using DAX calculated measures.
- Touch-supported on-chart interactions.
- Cross-chart filtering.
- Dynamic titles that help navigate your drill down level.
- Reset button for the entire report or a specific visual.
- Dark/light theme switch.
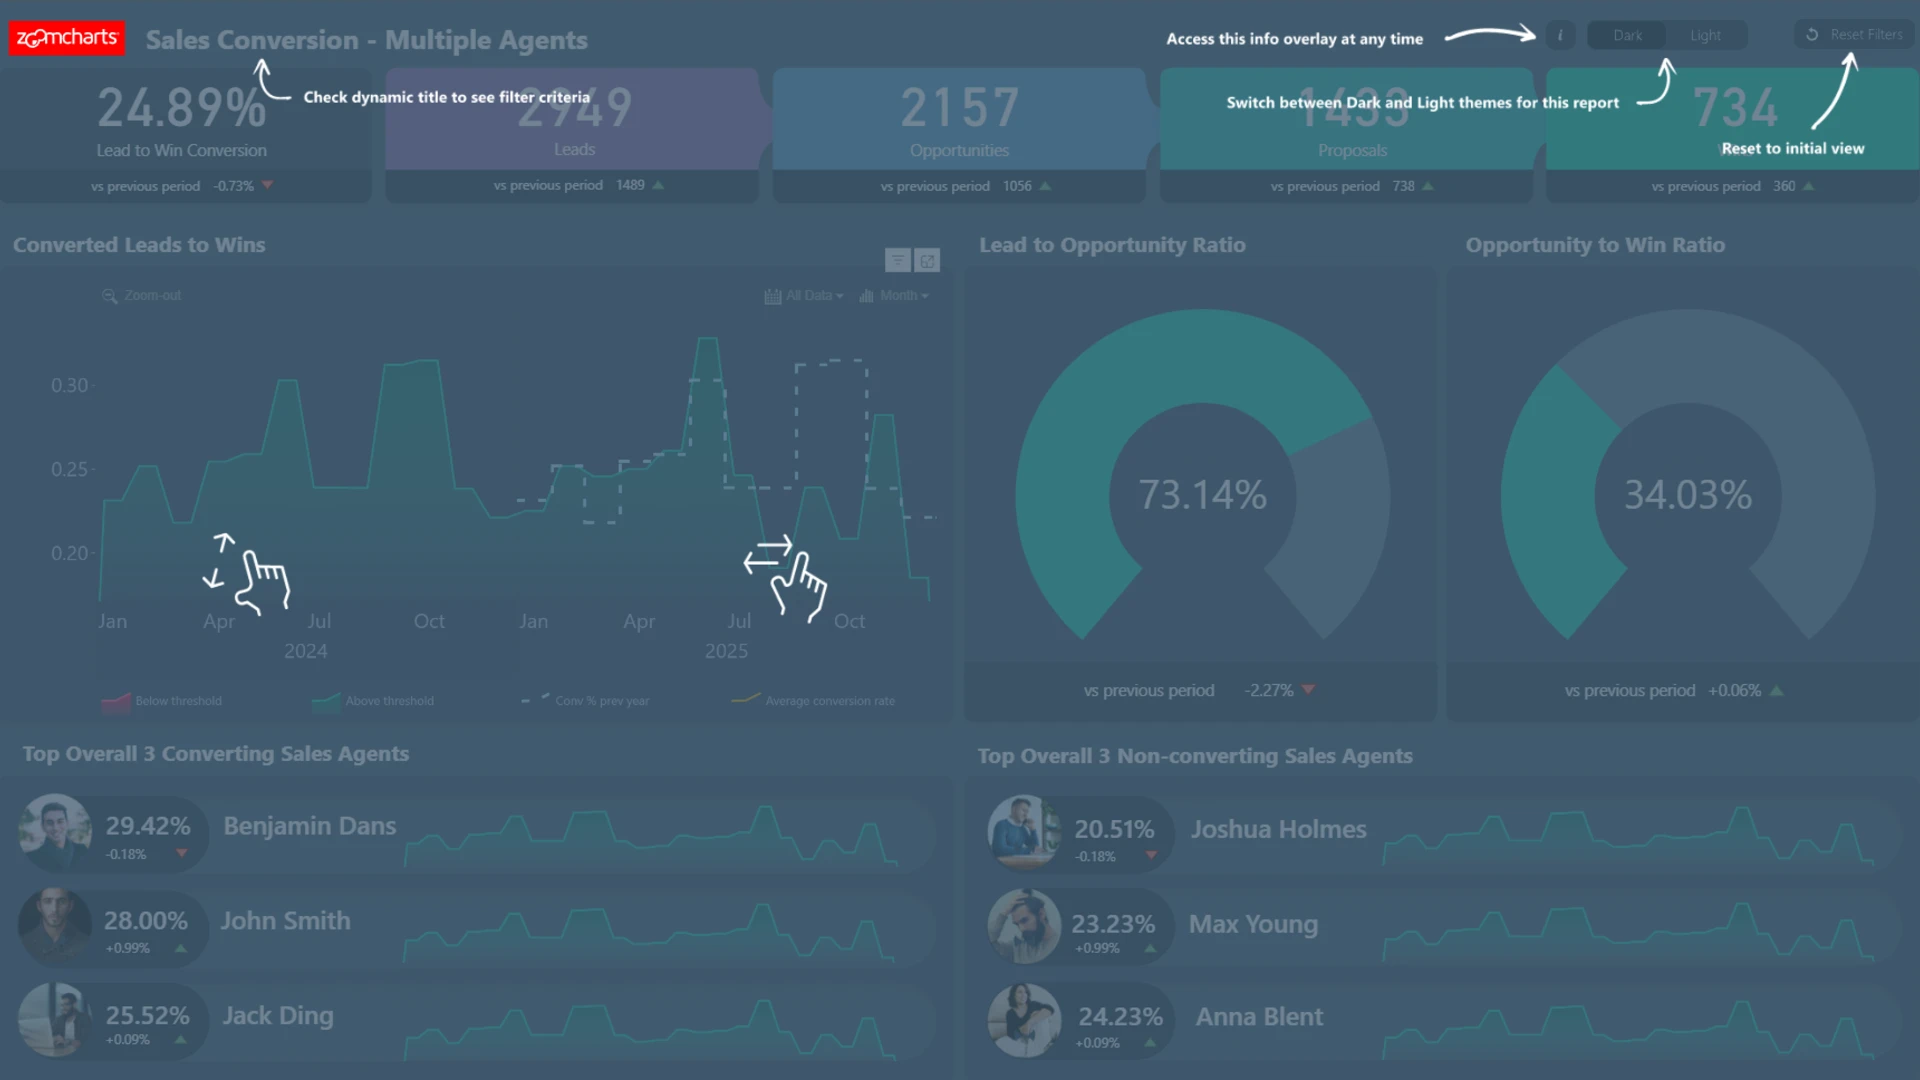
How To Use This Power BI Sales Analysis Report
To interact with this report, simply click on any active elements directly on the charts. You can also adjust the granularity of the data, letting you view years, months, or days.
If you need additional help, press the i button in the bottom left corner for an informational overlay to appear. Download this report to see all the settings, formulas, and calculations. Try it out with your own data by making a few adjustments.
Author:ZC
4U Report Challenges
Participate in data challenges, build and submit reports to get free template downloads.
Join CommunityMobile view allows you to interact with the report. To Download the template please switch to desktop view.
Was this helpful? Thank you for your feedback!
Sorry about that.
How can we improve it?