94412
Revenue vs. Budget Dashboard Example
Revenue vs. Budget Dashboard Example
Report Author: ZoomCharts
94412
Share template with others
Summary
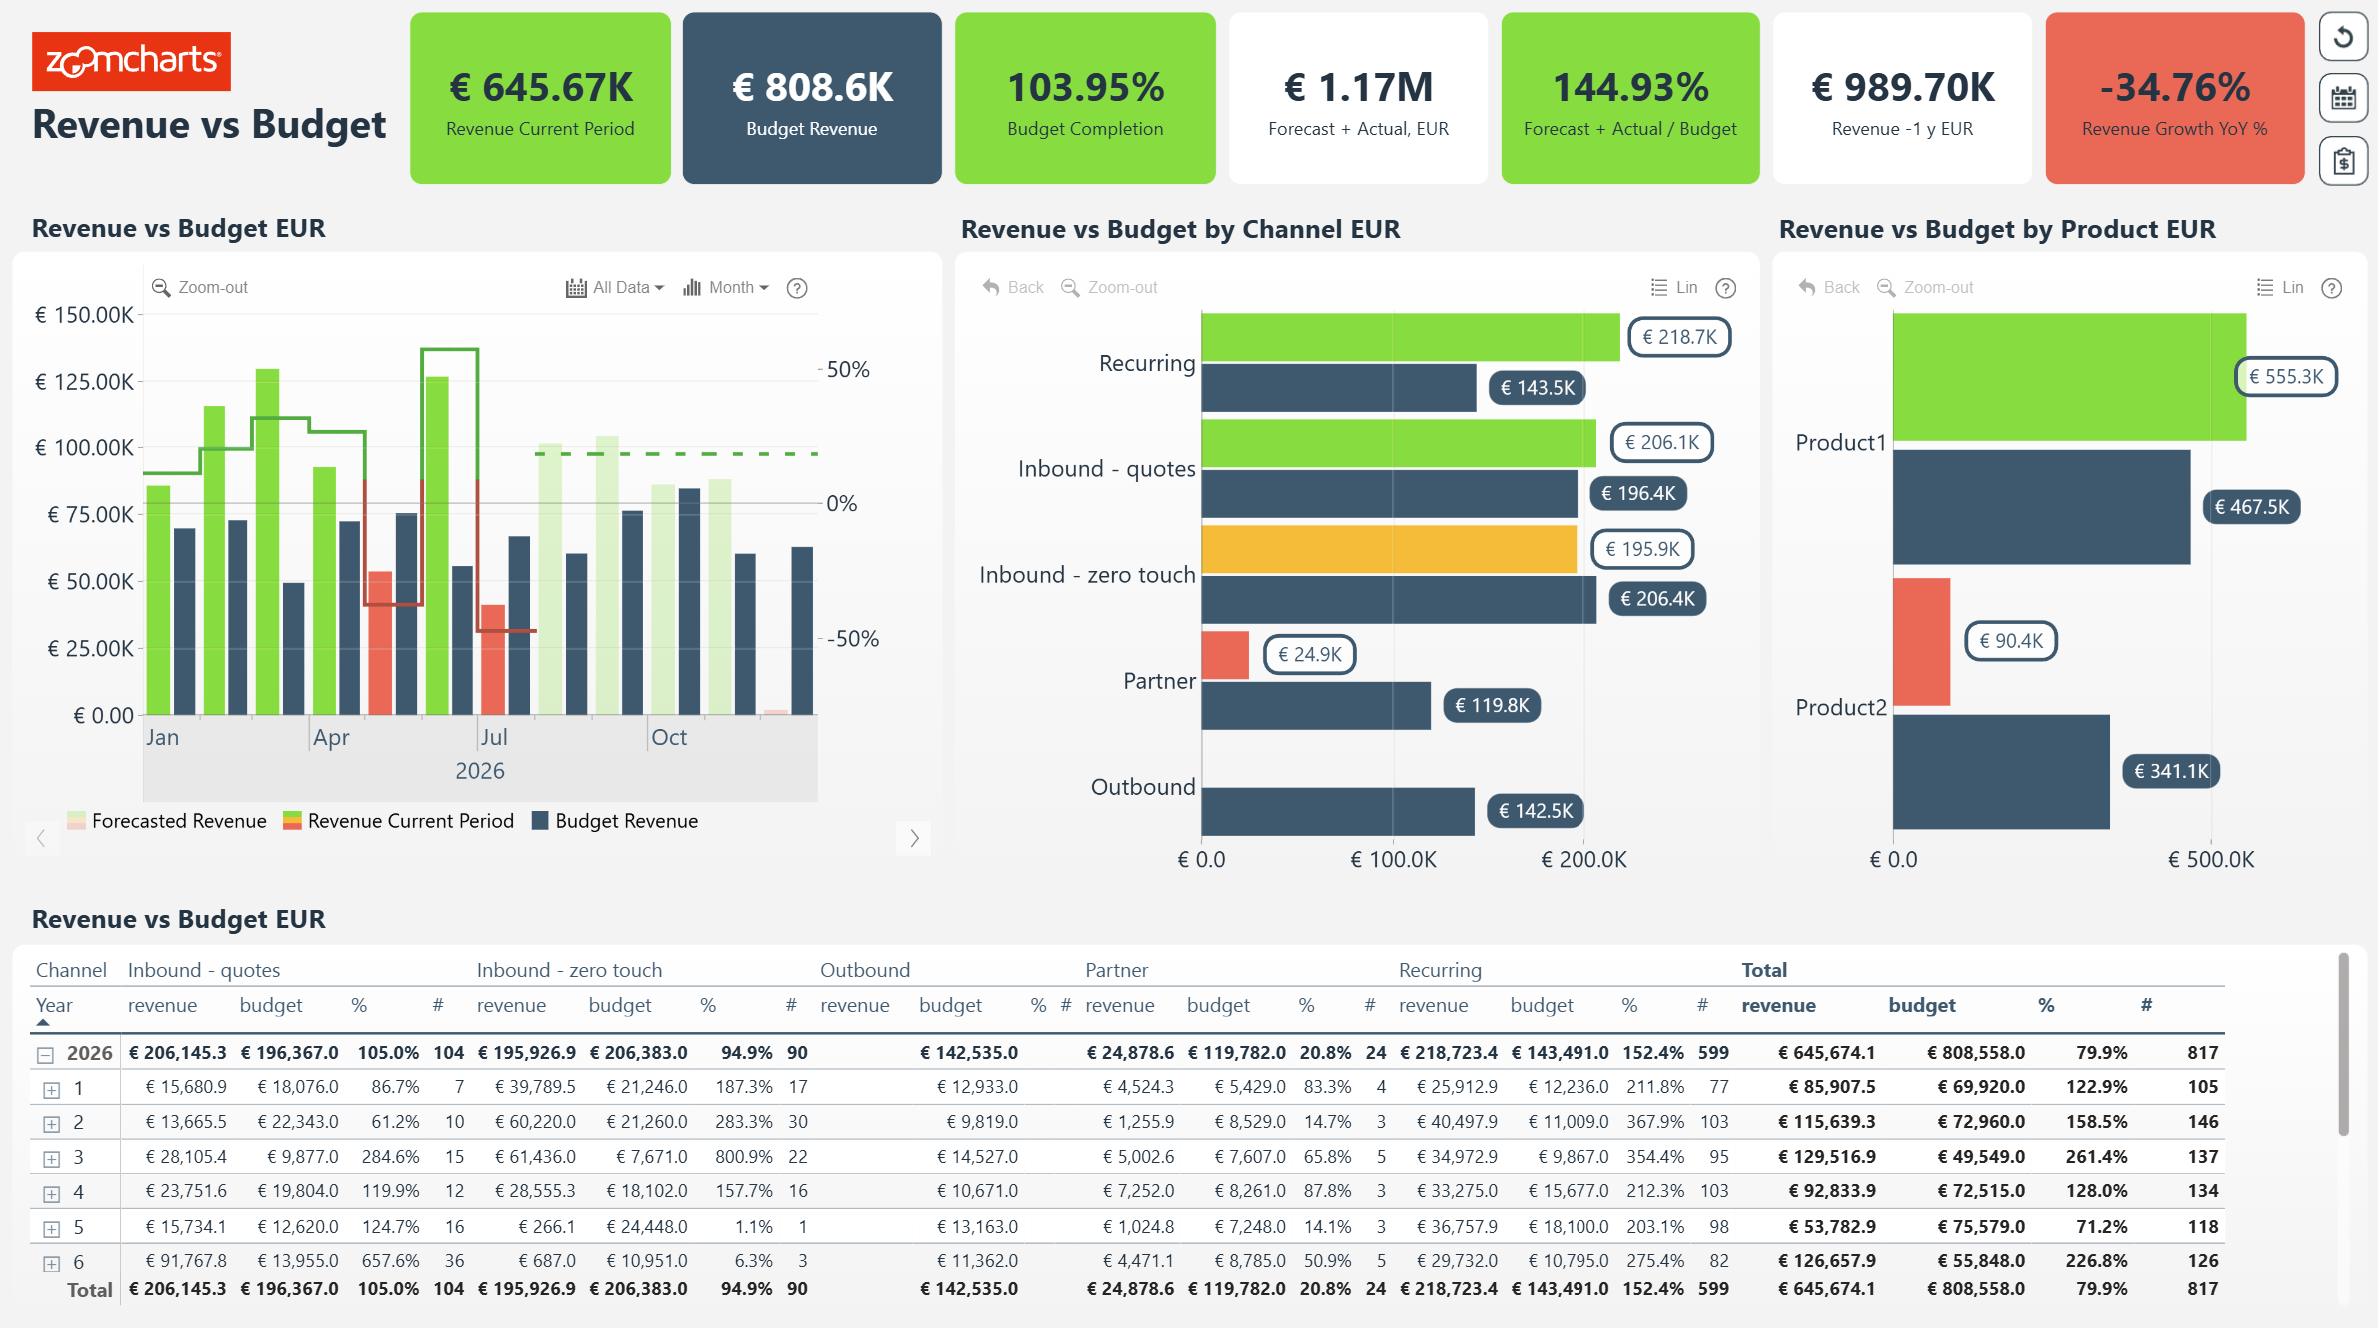
Gain a data-driven edge for your business with this free Power BI Revenue vs. Budget dashboard! Visualize, analyze and compare your budget against revenue to see how your actual numbers stack up against targets.
The main KPI to take note of in this Power BI revenue dashboard is Budget revenue. The interactive column chart displays an overall picture of Budget completion. You can see a line on the chart depicting past progress and a forecasted budget completion represented by the dashed line.
To compare more precise numbers, there is also a table on the bottom of this Power BI budget template for cross-checking.
Key Features
- Drill Down Timeline PRO lets you visualize and drill down time-based data using DAX calculated measures.
- Drill Down Combo PRO and Drill Down Combo Bar PRO lets you create all manners of bar and column charts.
- Conditional formatting.
- Cross-chart filtering.
- KPI Cards.
- Dynamic titles that help navigate your drill down level.
How To Use This Financial Power BI Dashboard
To interact with this Power BI financial dashboard template, simply click any active elements directly on the charts.
Download this PBIX dashboard template to see all the settings, formulas, and calculations. Try it out with your own data by making a few adjustments.


4U Report Challenges
Participate in data challenges, build and submit reports to get free template downloads.
Join CommunityMobile view allows you to interact with the report. To Download the template please switch to desktop view.
How to use a PBIX template
Preview the interactive report, download the PBIX file, open it in Power BI Desktop, and replace the same data connection with your own dataset.
Preview and download
Explore the report online and download the PBIX template file.
Open in Power BI Desktop
Open the downloaded PBIX file in Power BI Desktop.
Connect your data
Replace the sample data source with your own dataset.
Refresh and adjust
Refresh the model and update fields or visual were needed.
Save and share
Save your report and publish it for your audience.


