2029
CRM and Sales Pipeline Analysis Power BI Dashboard
CRM and Sales Pipeline Analysis Power BI Dashboard
More Report pages
Report Author: Ekaterina Vorobets
2029
Share template with others
Power BI CRM & Sales Pipeline Analysis Report
A Power BI report example for analyzing customer relationships, sales opportunities, pipeline movement, and revenue growth.
Explore a comprehensive CRM and Sales Pipeline Analysis report created for the FP20 Analytics Challenge using the Sales Pipeline use-case dataset. This Power BI dashboard helps sales leaders, account managers, and business decision-makers gain a complete view of customer relationships, sales opportunities, and pipeline performance throughout the sales cycle.
The dashboard provides an interactive environment for analyzing leads, accounts, opportunities, and sales outcomes. Users can track how prospects move through pipeline stages, identify bottlenecks that slow down conversions, and evaluate overall sales effectiveness.
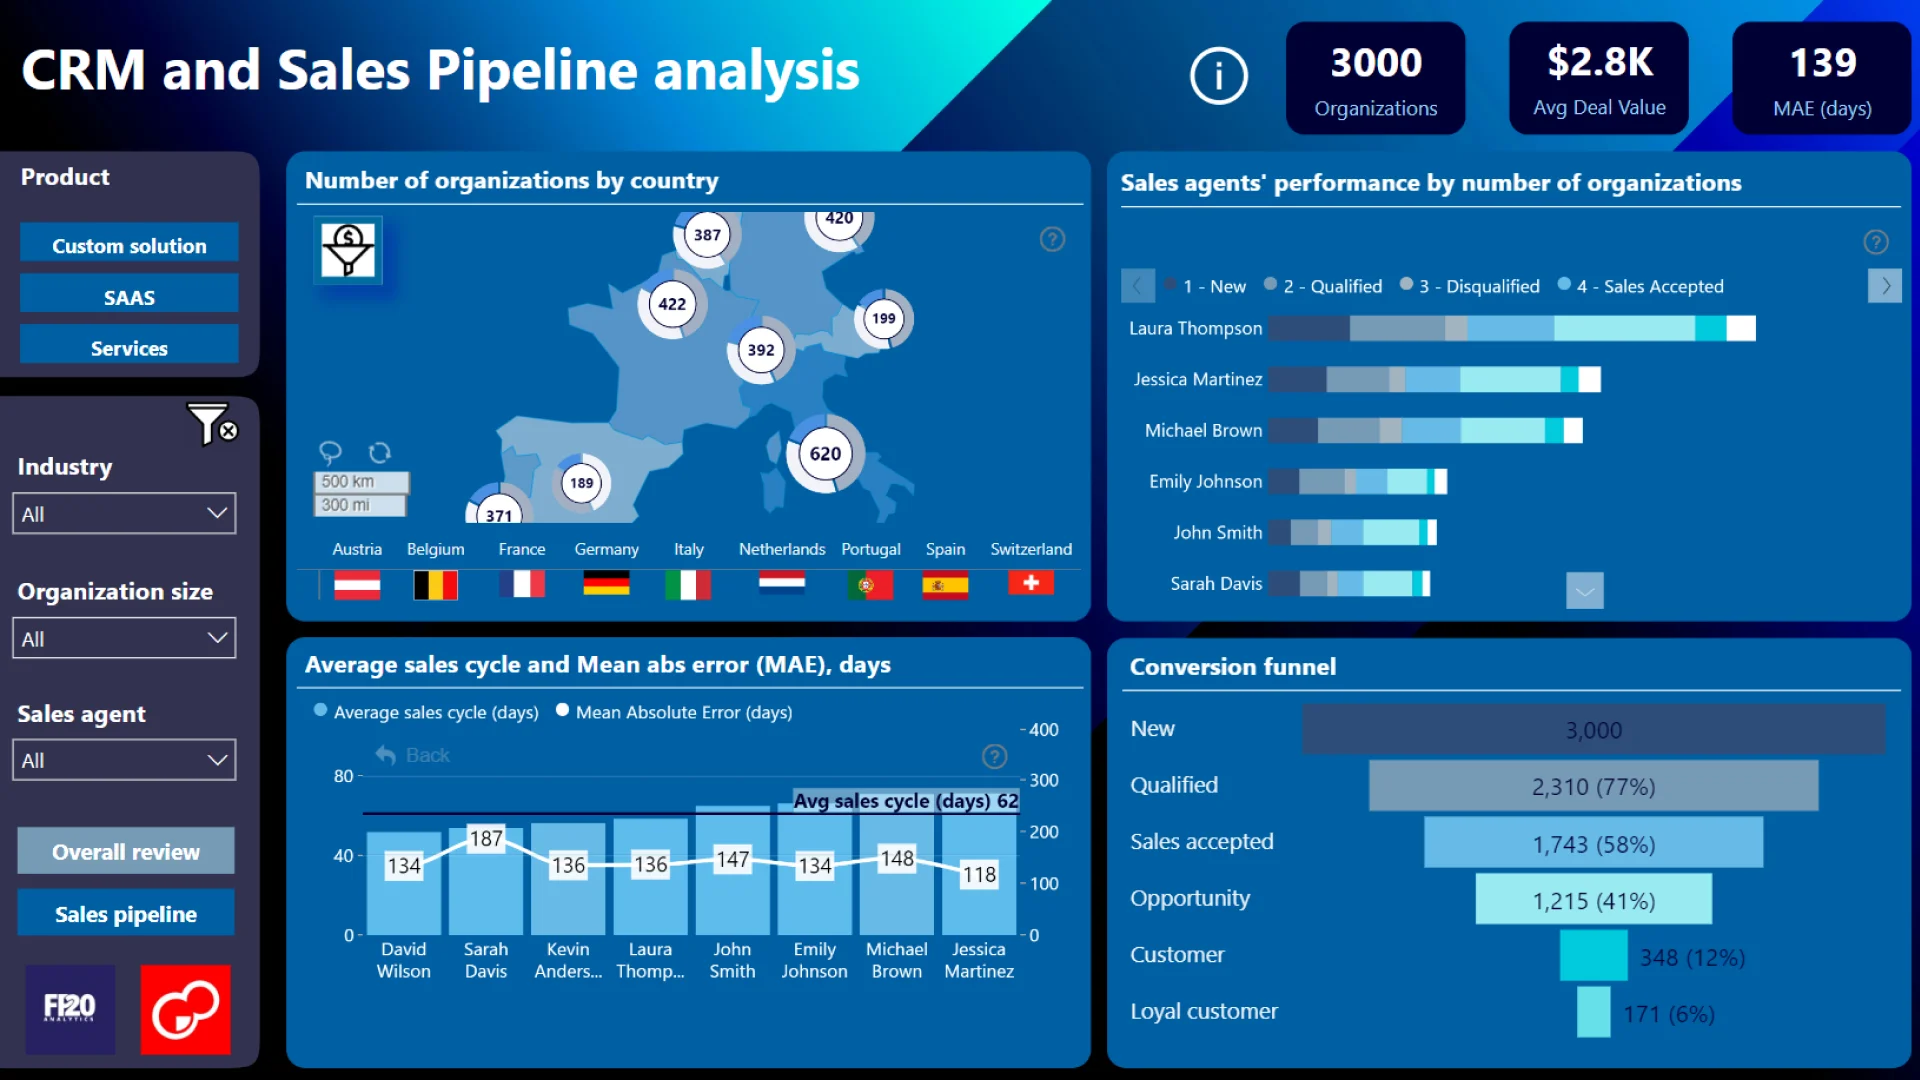
Key Insights of this dashboard
Pipeline Movement
Track how prospects move through pipeline stages and where opportunities slow down.
Sales Effectiveness
Evaluate opportunity progression, conversion patterns, deal outcomes, and sales performance.
Customer & Account Analysis
Analyze customer relationships, account activity, engagement patterns, and business segments.
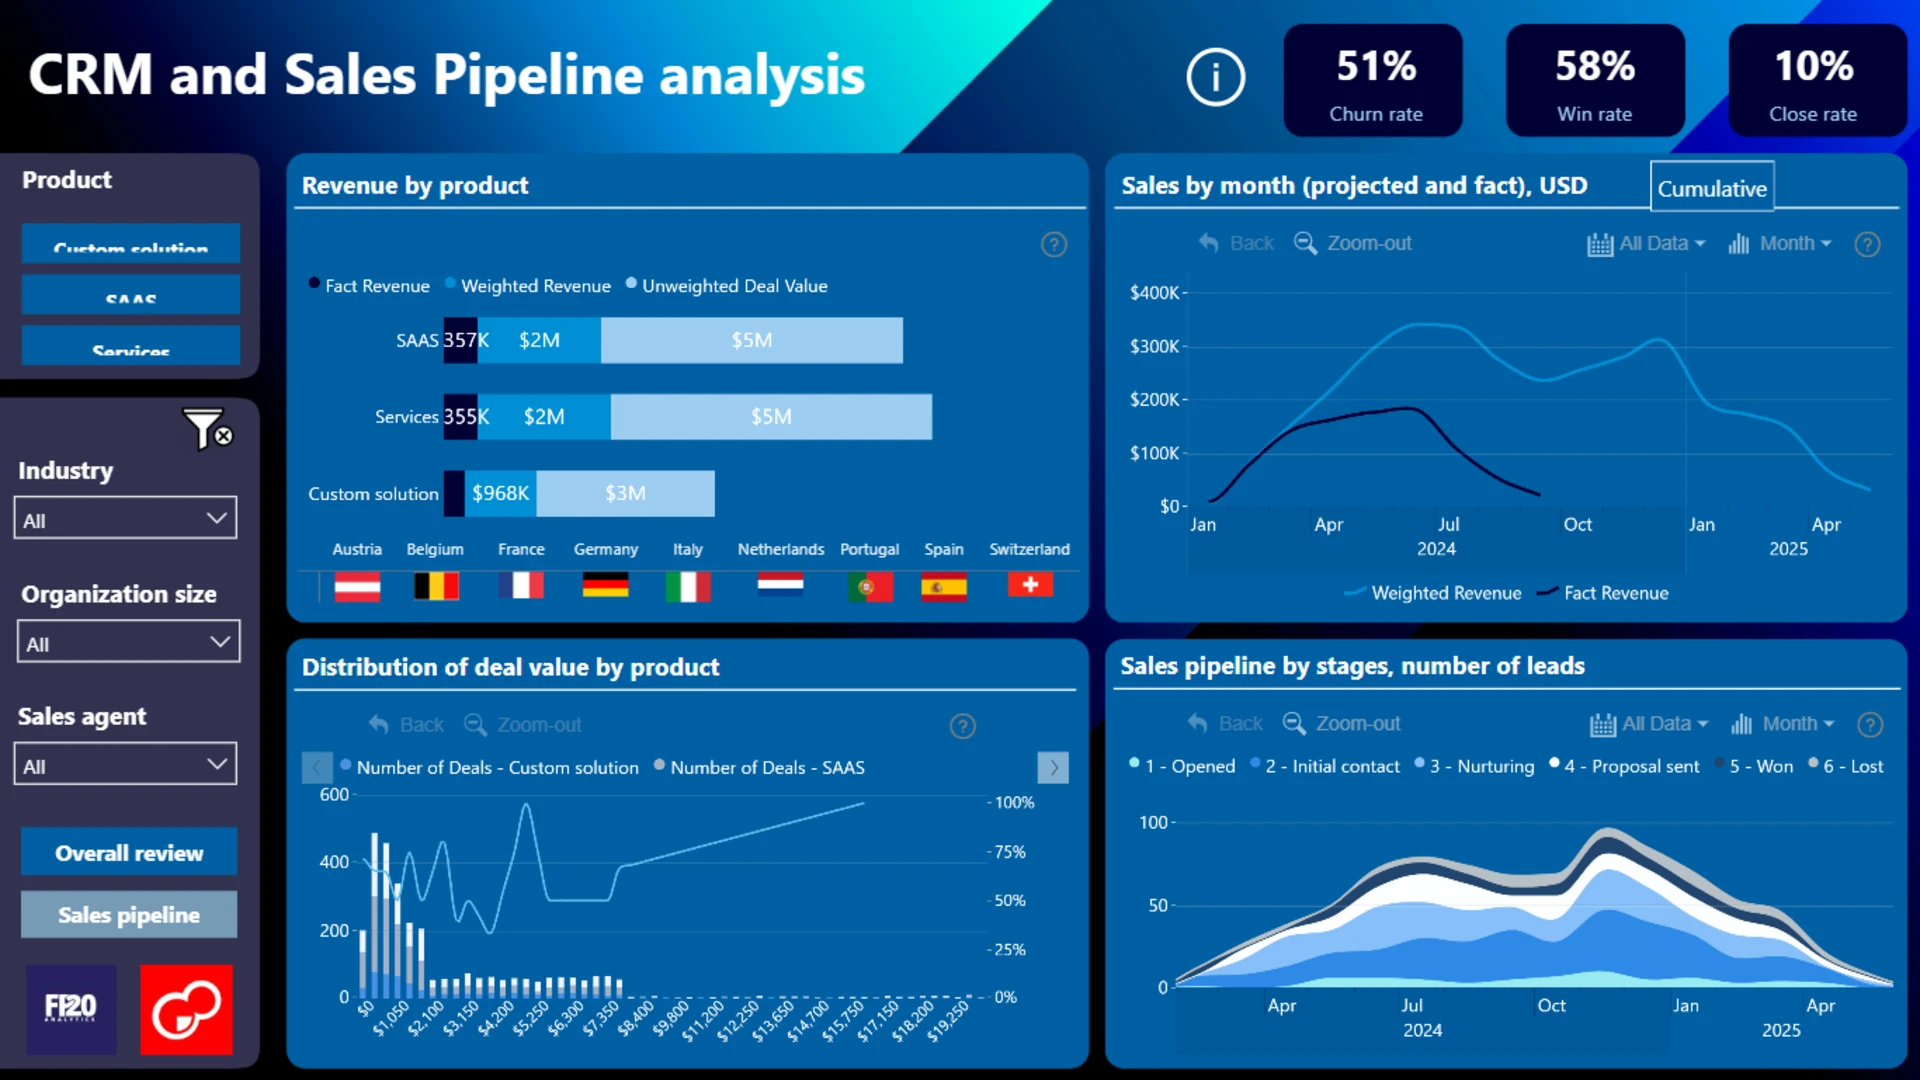
Deal Value Distribution
Understand how opportunity value is distributed across reps, products, regions, and time periods.
Pipeline Health
Monitor high-value opportunities, at-risk deals, sales funnel efficiency, and revenue potential.
Revenue Growth Drivers
Identify factors influencing deal success, delayed opportunities, lost deals, and growth outcomes.
Why use this dashboard
The dashboard enables users to explore sales activity from multiple perspectives, including individual sales representatives, customer segments, products, regions, and time periods. Stakeholders can compare performance across teams, monitor pipeline health, identify high-value opportunities, and better understand factors influencing deal success.
How to use this CRM & Sales Pipeline dashboard
Start with KPIs
Review high-level sales, pipeline, and customer relationship metrics.
Drill into details
Move from summary views into detailed transactional data and opportunity records.
Compare performance
Analyze reps, customer segments, products, regions, and time periods side by side.
Dashboard Highlights
Advanced filtering and drill-through capabilities allow users to move seamlessly from high-level KPIs to detailed data, making it easier to investigate trends, analyze customer behavior, evaluate sales funnel efficiency, and uncover actionable insights.
ZoomCharts visuals used
4U Report Challenges
Participate in data challenges, build and submit reports to get free template downloads.
Join CommunityMobile view allows you to interact with the report. To Download the template please switch to desktop view.

Was this helpful? Thank you for your feedback!
Sorry about that.
How can we improve it?