62
Recruitment Analytics Power BI Dashboard
Recruitment Analytics Power BI Dashboard
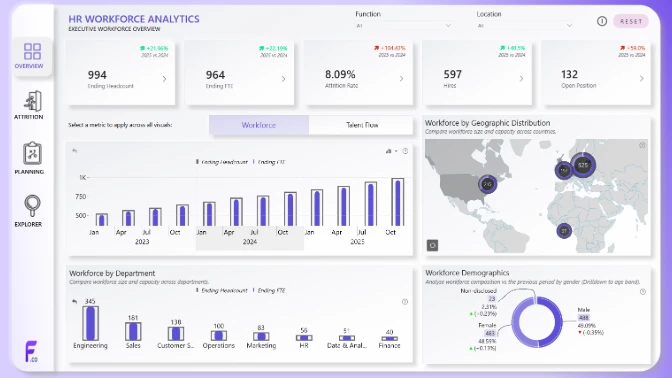
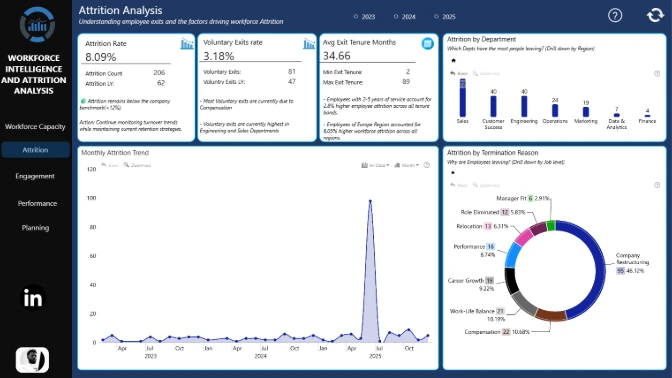
More Report pages
Report Author: ZoomCharts
62
Share template with others
Summary
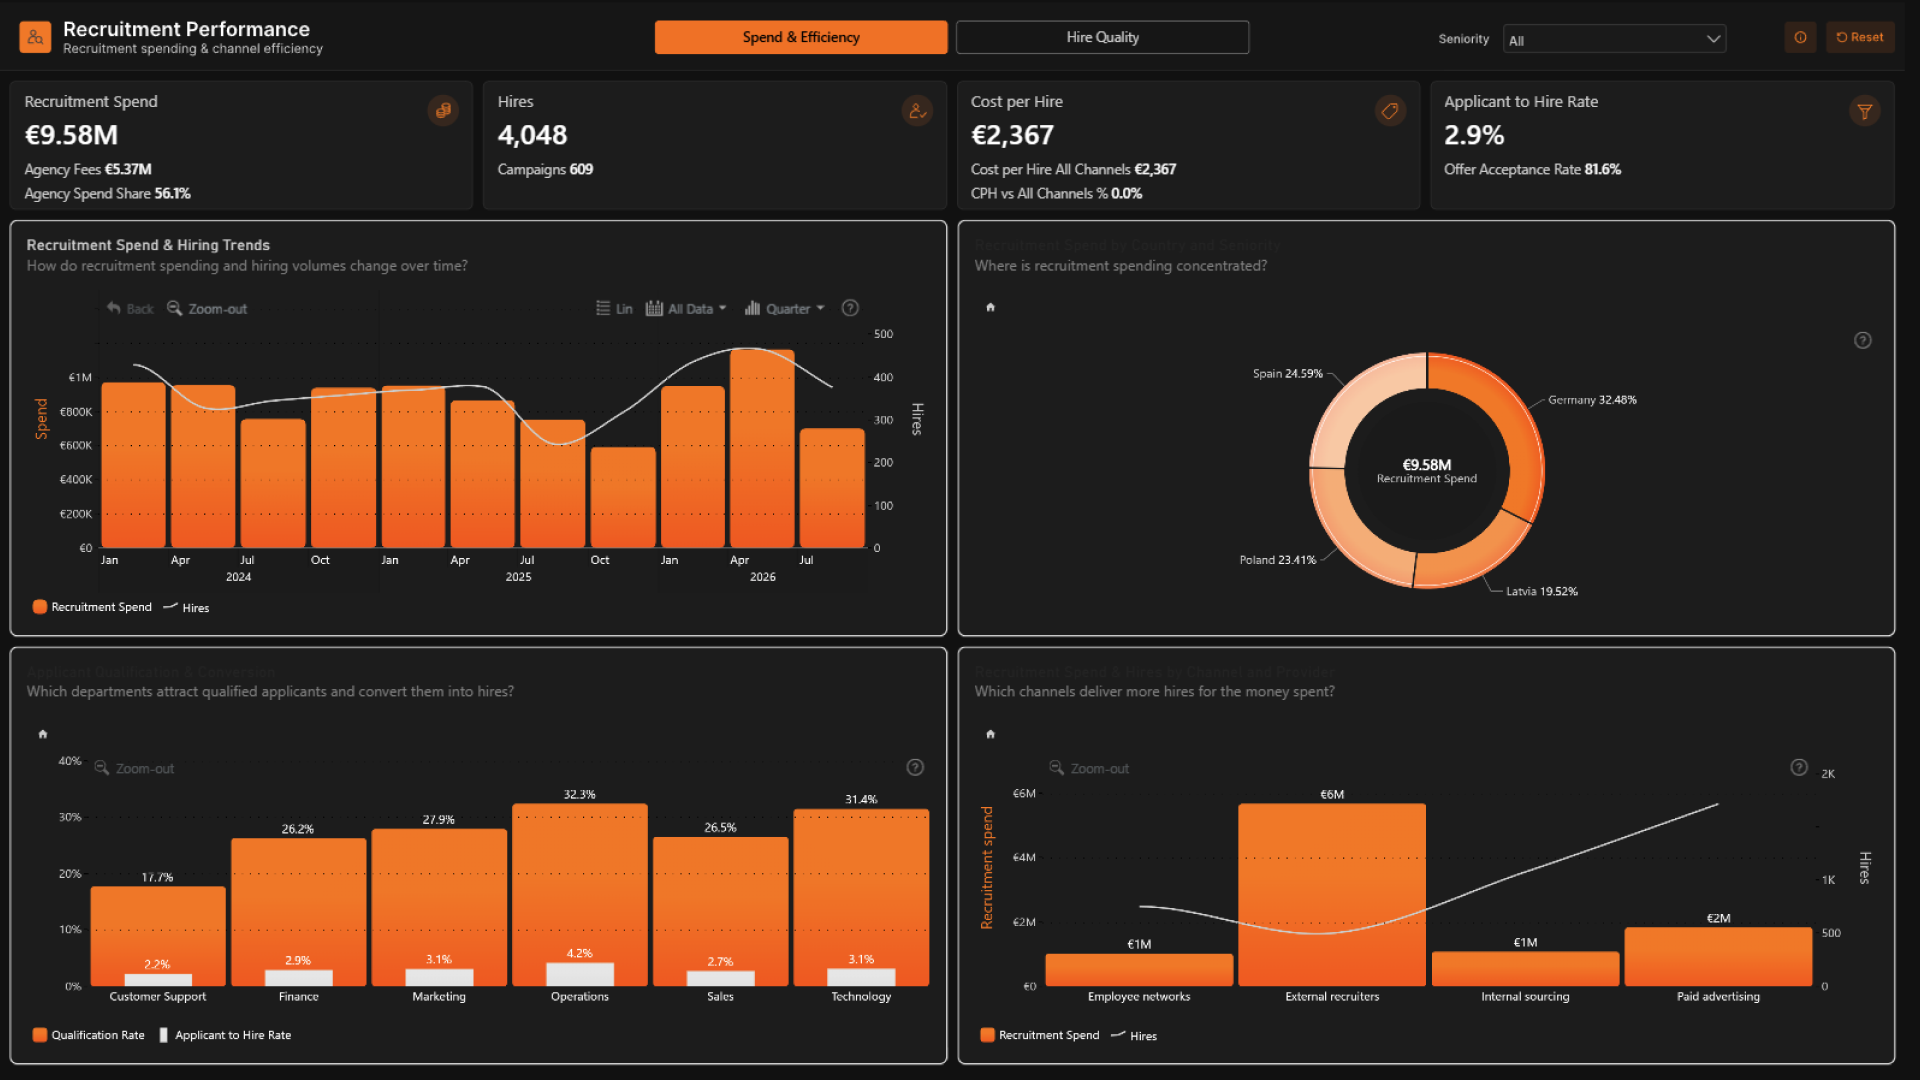
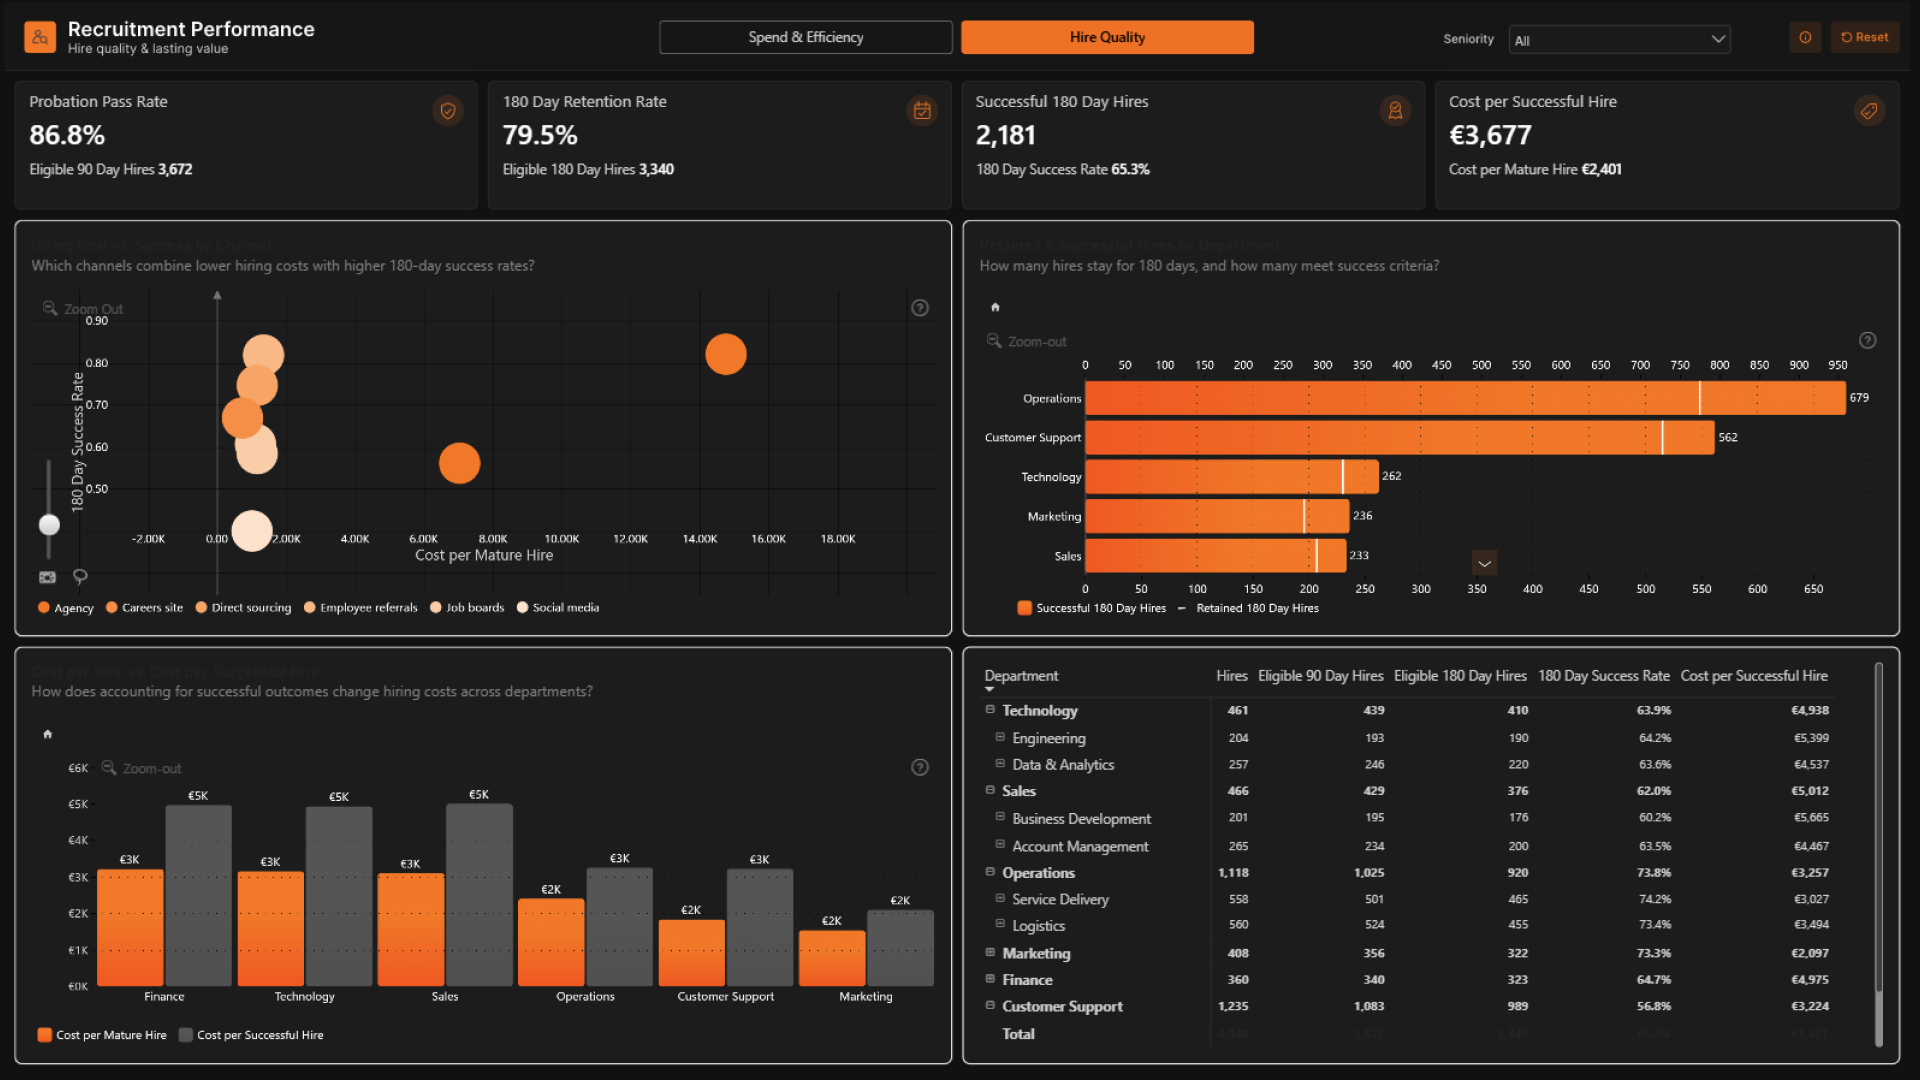
This Recruitment Analytics Power BI Dashboard example provides an interactive overview of hiring performance, recruitment spending, and talent acquisition efficiency. It is a practical example of using Power BI for HR analytics and recruitment reporting, helping HR professionals monitor hiring KPIs, evaluate recruitment channels, and identify opportunities to reduce hiring costs.
Key Insights of Power BI Recruitment Dashboard
The dashboard provides insights into key recruitment metrics, including:
-
Recruitment Costs: Total recruitment spending, agency fees, cost per hire, and spending trends over time.
-
Hiring Performance: Total hires, applicant-to-hire conversion rates, offer acceptance rates, and recruitment trends.
-
Recruitment Channel Analysis: Compare recruitment spending and hiring results across external recruiters, job advertising, employee networks, and internal sourcing.
-
Applicant Quality: Analyze applicant qualification rates and hiring conversion across departments.
-
Geographic Analysis: Explore recruitment spending by country and seniority level.
Interactive Power BI charts and ZoomCharts drill-down visuals make it easy to explore recruitment data, compare hiring performance, and identify the most cost-effective talent acquisition strategies.
How to Use This Power BI Recruitment Analytics Dashboard
Click on interactive charts to filter recruitment data and explore hiring trends across departments, countries, and recruitment channels. Switch between Spend & Efficiency and Hire Quality views to analyze recruitment costs and hiring outcomes from different perspectives.
Use this Power BI HR dashboard example as inspiration for creating recruitment reports and tracking talent acquisition KPIs.
ZoomCharts visuals used



4U Report Challenges
Participate in data challenges, build and submit reports to get free template downloads.
Join CommunityMobile view allows you to interact with the report. To Download the template please switch to desktop view.
How to use a PBIX template
Preview the interactive report, download the PBIX file, open it in Power BI Desktop, and replace the same data connection with your own dataset.
Preview and download
Explore the report online and download the PBIX template file.
Open in Power BI Desktop
Open the downloaded PBIX file in Power BI Desktop.
Connect your data
Replace the sample data source with your own dataset.
Refresh and adjust
Refresh the model and update fields or visual were needed.
Save and share
Save your report and publish it for your audience.


