88
Real Estate Investment Insights Dashboard 6
Real Estate Investment Insights Dashboard 6
Report Author: Poojitha Kolli
88
Share template with others
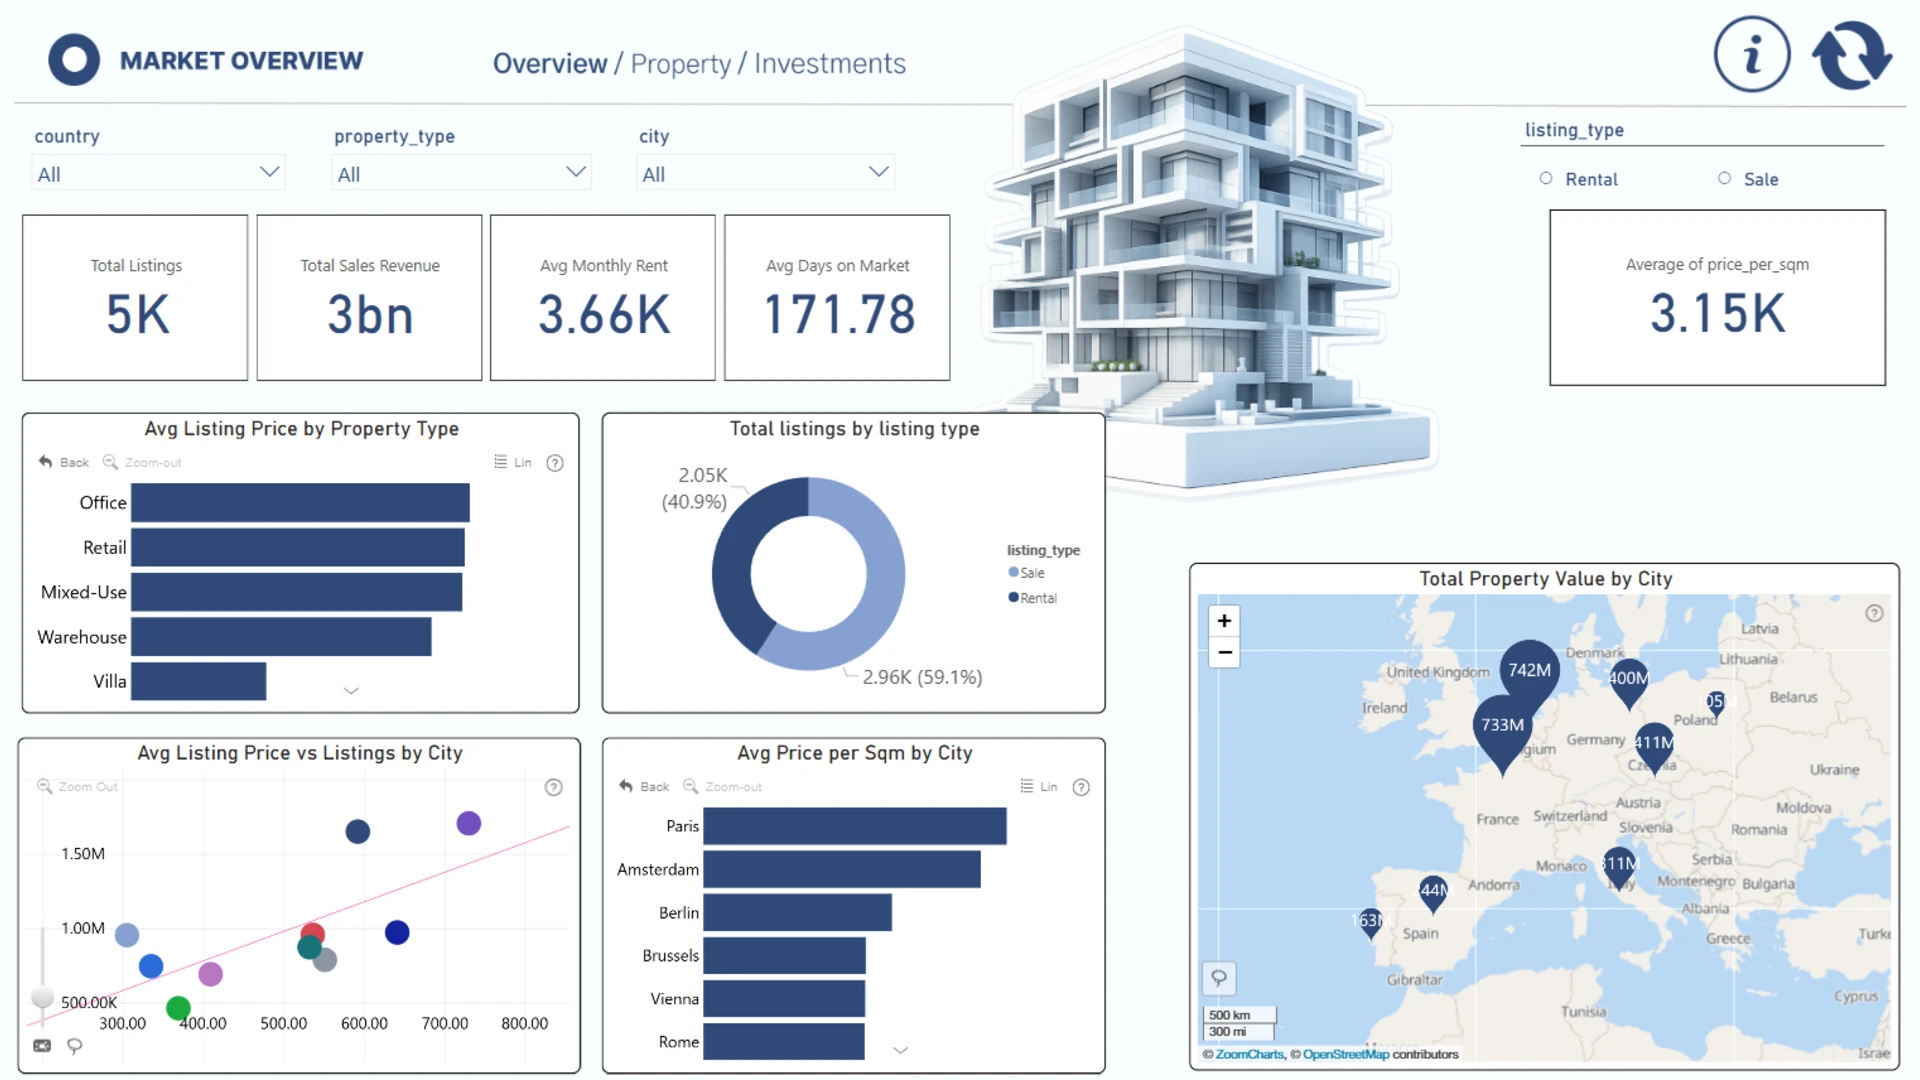
This interactive Power BI report explores the European Real Estate Market Analytics dataset using ZoomCharts Drill Down custom visuals for Power BI. It highlights property prices, price per square meter, listing activity, and property characteristics across countries and cities, helping users identify market trends, compare locations, and evaluate investment opportunities.
The report was submitted to the FP20 Analytics ZoomCharts Data Challenge #36 (March – April 2026).
Author’s Description:
This dashboard provides a comprehensive analysis of the European real estate market, highlighting pricing trends, property distribution, and key value drivers. It enables users to compare property prices across cities, understand the factors influencing pricing—such as size, amenities, and energy efficiency-and identify high-value, low-activity markets for investment opportunities.
ZoomCharts visuals used
Need help?
Send your question to ZoomCharts assistant, and we will respond to you as soon as possible.
Contact UsMobile view allows you to interact with the report. To Download the template please switch to desktop view.


Was this helpful? Thank you for your feedback!
Sorry about that.
How can we improve it?