123
Real Estate Analytics Power BI Dashboard 5
Real Estate Analytics Power BI Dashboard 5
Report Author: Agbata Dickson Ukolojo
123
Share template with others
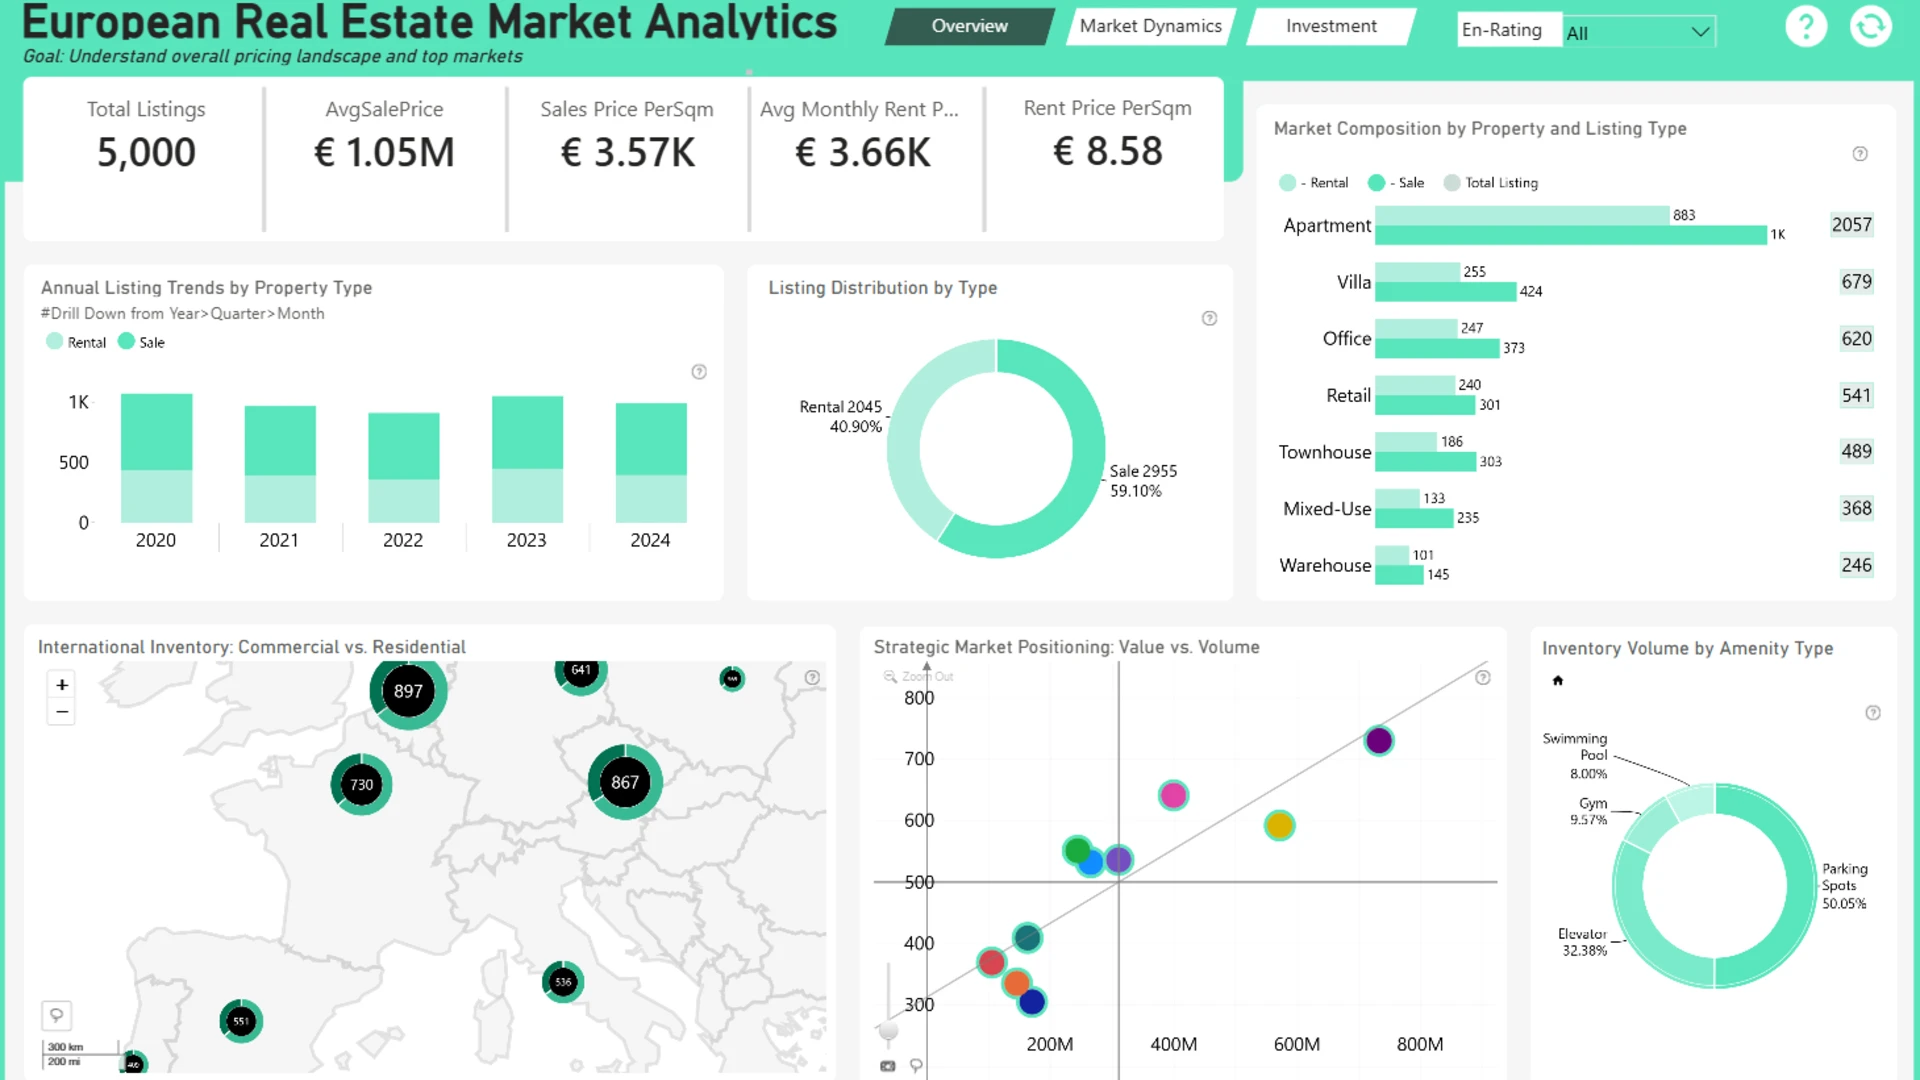
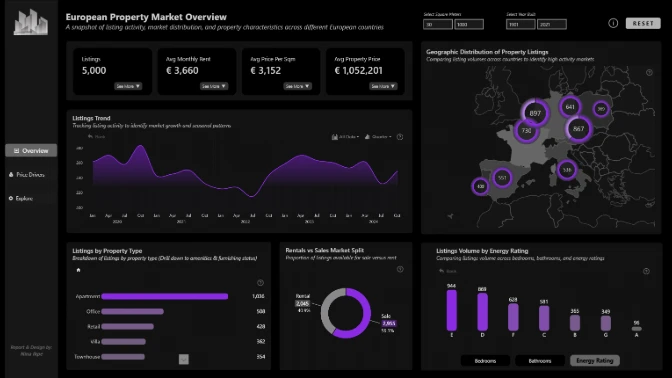
This interactive Power BI report explores the European Real Estate Market Analytics dataset using ZoomCharts Drill Down custom visuals for Power BI. It highlights property prices, price per square meter, listing activity, and property characteristics across countries and cities, helping users identify market trends, compare locations, and evaluate investment opportunities.
The report was submitted to the FP20 Analytics ZoomCharts Data Challenge #36 (March – April 2026).
ZoomCharts visuals used
Need help?
Send your question to ZoomCharts assistant, and we will respond to you as soon as possible.
Contact UsMobile view allows you to interact with the report. To Download the template please switch to desktop view.


Was this helpful? Thank you for your feedback!
Sorry about that.
How can we improve it?