logo
For Power BI Report Templates
  • Products
    • Custom Visuals for Power BI
    • Report Templates
  • Resources

      Resources

    • Documentation
    • Report Examples
    • Blog
    • Webinars
    • Video Tutorials
    • Visuals Gallery

    Support

    • ZoomCharts Assistance
    • Contact Sales
    • Contact Support
    • FAQ

    Challenges

    Challenges

    Improve your report creation skills by participating in free challenges for report creators.

    Learn more
    Get Developer License
  • Services
    • Power BI Report Development
    • Custom Visual Development
  • Challenges
  • Pricing
Get started
Get started
Get it now
Go back

Contents

Dashboard and report examples Project Management Dashboard in Power BI for fintech projects
Go back

2521

Project Management Dashboard in Power BI for fintech projects

Project Management Dashboard in Power BI for fintech projects

Report
Report
Report

More Report pages

Report
Report
Report
Report
Report
Report
Report Interact

Report Author: Akindele Omolayo

2521

Combo Combo Bar Timeline Donut Banking

Share template with others

This project management dashboard example shows how Power BI can be used to analyze fintech project delivery, budget efficiency, resource utilization, employee performance, and task progress in one interactive report.

Built with the Fintech Project Management dataset, this dashbaord was submitted to the FP20 Analytics ZoomCharts Data Challenge 32 in November 2025.

Designed for project managers, PMO teams, business analysts, delivery managers, and executives, this Power BI project management dashboard example helps users monitor project performance and explore details by budget, hours, risks, departments, employees, tasks, and milestones.

What you can analyze

Use this report to track:

  • Project status: completed, delayed, not started, and in progress
  • Budget performance: planned budget, actual budget, budget usage, and variance
  • Resource utilization: planned vs. actual hours and hours usage
  • Department performance: cost efficiency and delivery performance by department
  • Employee performance: delivery results by department head and team
  • Risk analysis: project count and budget allocation by risk level
  • Milestone delays: delay trends by department head and project area

Report pages

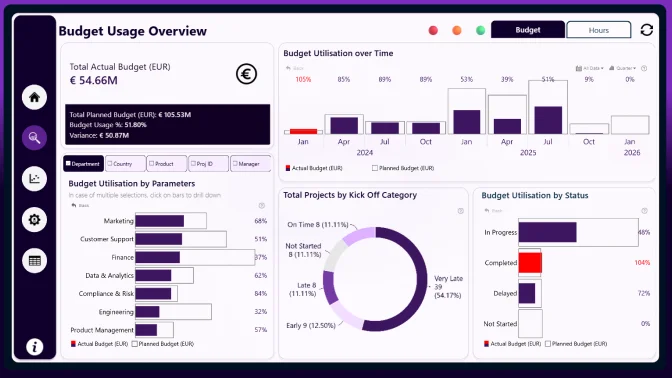
  • Project delivery overview: review overall project health, budget usage, project status, risk levels, and budget trends over time.
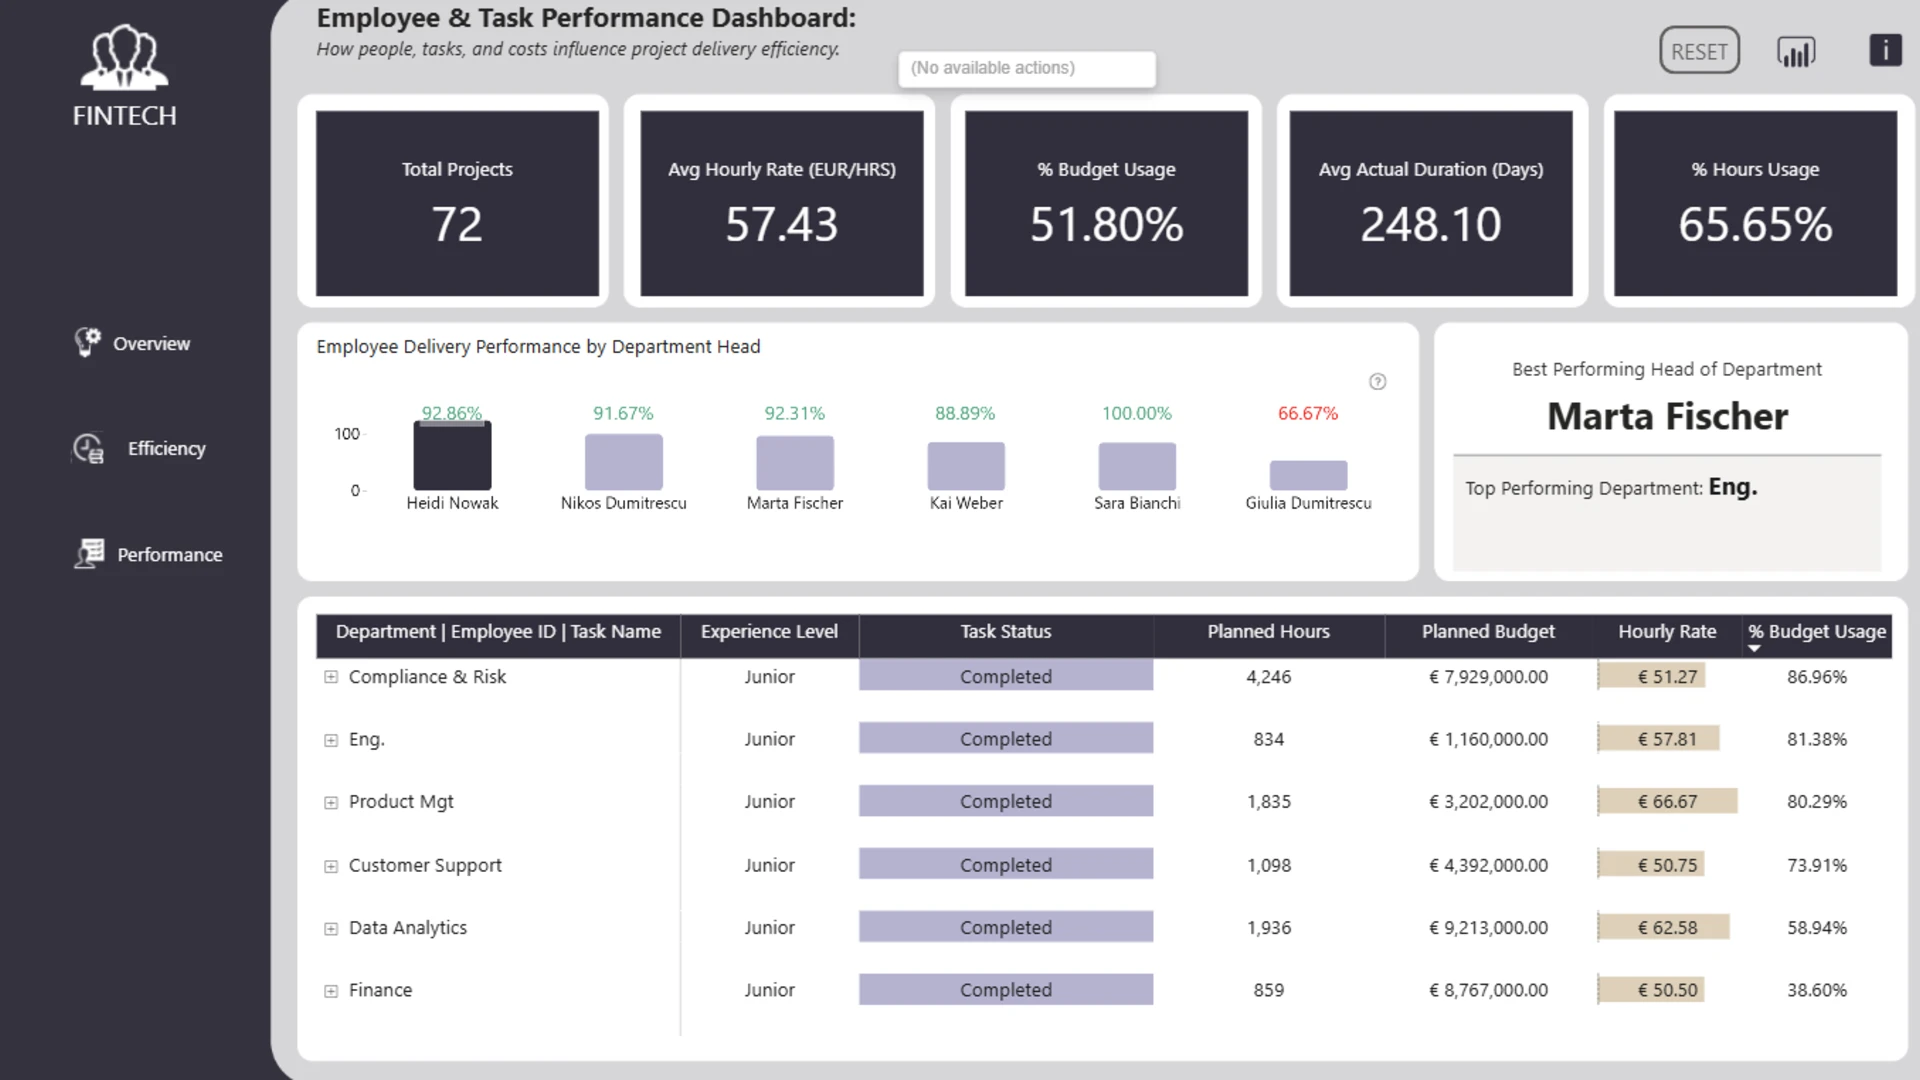
  • Employee and task performance: analyze how employees, tasks, costs, and hours affect delivery efficiency.
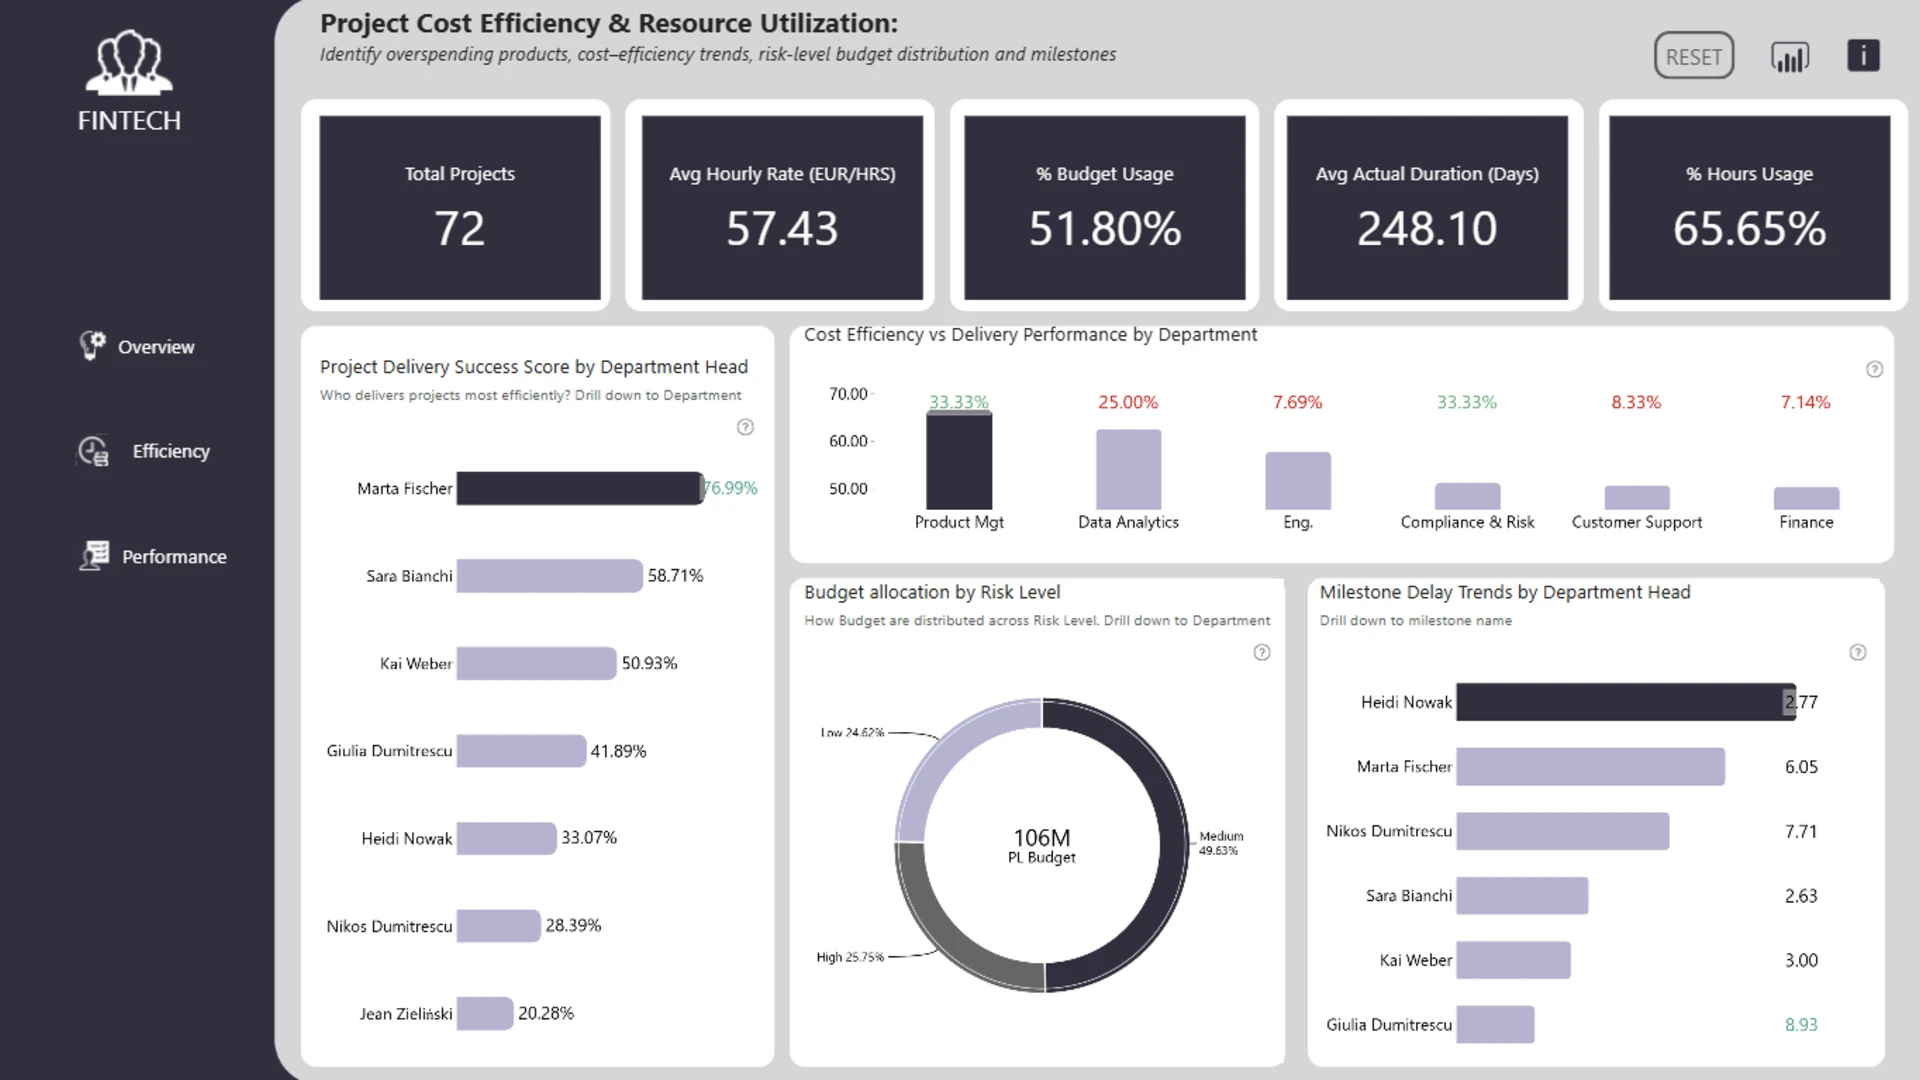
  • Project cost efficiency and resource utilization: compare cost efficiency, delivery performance, risk-based budget allocation, and milestone delays.

Interactive features

This report combines ZoomCharts Drill Down PRO visuals with native Power BI visuals so users can click directly on charts, drill down into departments, products, project IDs, and milestones, switch between budget and hours metrics, filter by project status and risk level, and reset the dashboard with one click.

Try & Download this Power BI project management dashboard example to explore the full setup and adapt it to your own project management, PMO, fintech, operations, or resource planning data.

ZoomCharts visuals used

Drill Down Combo PRO Drill Down Combo PRO
Drill Down Combo Bar PRO Drill Down Combo Bar PRO
Drill Down Timeline PRO Drill Down Timeline PRO
Drill Down Donut PRO Drill Down Donut PRO

4U Report Challenges

Participate in data challenges, build and submit reports to get free template downloads.

Join Community

Mobile view allows you to interact with the report. To Download the template please switch to desktop view.

Similar reports

All Reports 2 results
New
Report Card

Fintech Project Delivery Analysis

520

New
Report Card

Project Management Dashboard

1279

Explore all reports

Was this helpful? Thank you for your feedback!

Sorry about that.

How can we improve it?

Project Management Dashboard in Power BI for fintech projects

Report Author: Akindele Omolayo

2521

ZoomCharts

Welcome to ZoomCharts

You’re almost there! Create an account to download reports.

or
Sign up with Microsoft

Verify your email address

We have sent a code to your email address. Please input the code below.

Didn't receive code? Request again (after 30 seconds)

Already have an account? Log in

ZoomCharts

Log in to your ZoomCharts account

Log in with Microsoft
or
Forgot password?

Reset your password

We'll email you instructions on how to reset your password

Don't have an account? Sign up

Please add credits

You have 0 available downloads.
Get more credits or upgrade your plan to continue.

View pricing
logo
[email protected]
+44 204 577 3993
logo

Products

Drill Down Bubble PRO Drill Down Line PRO Drill Down Network PRO Drill Down Waterfall PRO Drill Down Graph PRO Drill Down Combo PRO Drill Down Combo Bar PRO Drill Down Donut PRO Drill Down Pie PRO Drill Down TimeSeries PRO Drill Down Timeline PRO Drill Down Map PRO Drill Down Scatter PRO All Visuals

Resources

Report Examples Webinars Blog ZoomCharts Academy Visuals Gallery Documentation Custom Visual Development Subscribe to News

Solutions

Custom Visual Development

Company

Pricing About Us Partners Leave feedback Join PowerGroup EU Funding

Help

ZoomCharts Assistance Contact Sales Contact Support FAQ AI Information

Drill Down Line PRO Drill Down Bubble PRO Drill Down Network PRO Drill Down Waterfall PRO Drill Down Graph PRO Drill Down Combo PRO Drill Down Combo Bar PRO Drill Down Donut PRO Drill Down Pie PRO Drill Down TimeSeries PRO Drill Down Timeline PRO Drill Down Map PRO Drill Down Scatter PRO All Visuals

Report Examples Webinars Blog ZoomCharts Academy Visuals Gallery Documentation Custom Visual Development Subscribe to News

Custom Visual Development

Pricing About Us Partners Leave feedback Join PowerGroup EU Funding

ZoomCharts Assistance Contact Sales Contact Support FAQ AI Information
+44 204 577 3993
[email protected]

Ready to get in touch?

Contact our experts with any question about Power BI and ZoomCharts for Free!

Contact us

© 2026, Data Visualization Software Lab

U.S. Patents No. 11,645,343; 11,921,804; 12,346,389

Cookies
Privacy Policy
Global
Legal
Patent
warning

Error message

success

Success info: Done!

ZoomCharts AI Assistant

We noticed you're using an old OS version.

For the best experience, we recommend upgrading to ensure that all website features display correctly.

Cookie settings

We use necessary cookies for site functionality, as well as statistic, marketing, and preference cookies to enhance your experience. For more information and to manage your preferences, please visit our Cookie policy