669
Power BI Waterfall Chart Sales Dashboard
Power BI Waterfall Chart Sales Dashboard
More Report pages
Report Author: Fabian Vicencio Islas
669
Share template with others
Summary
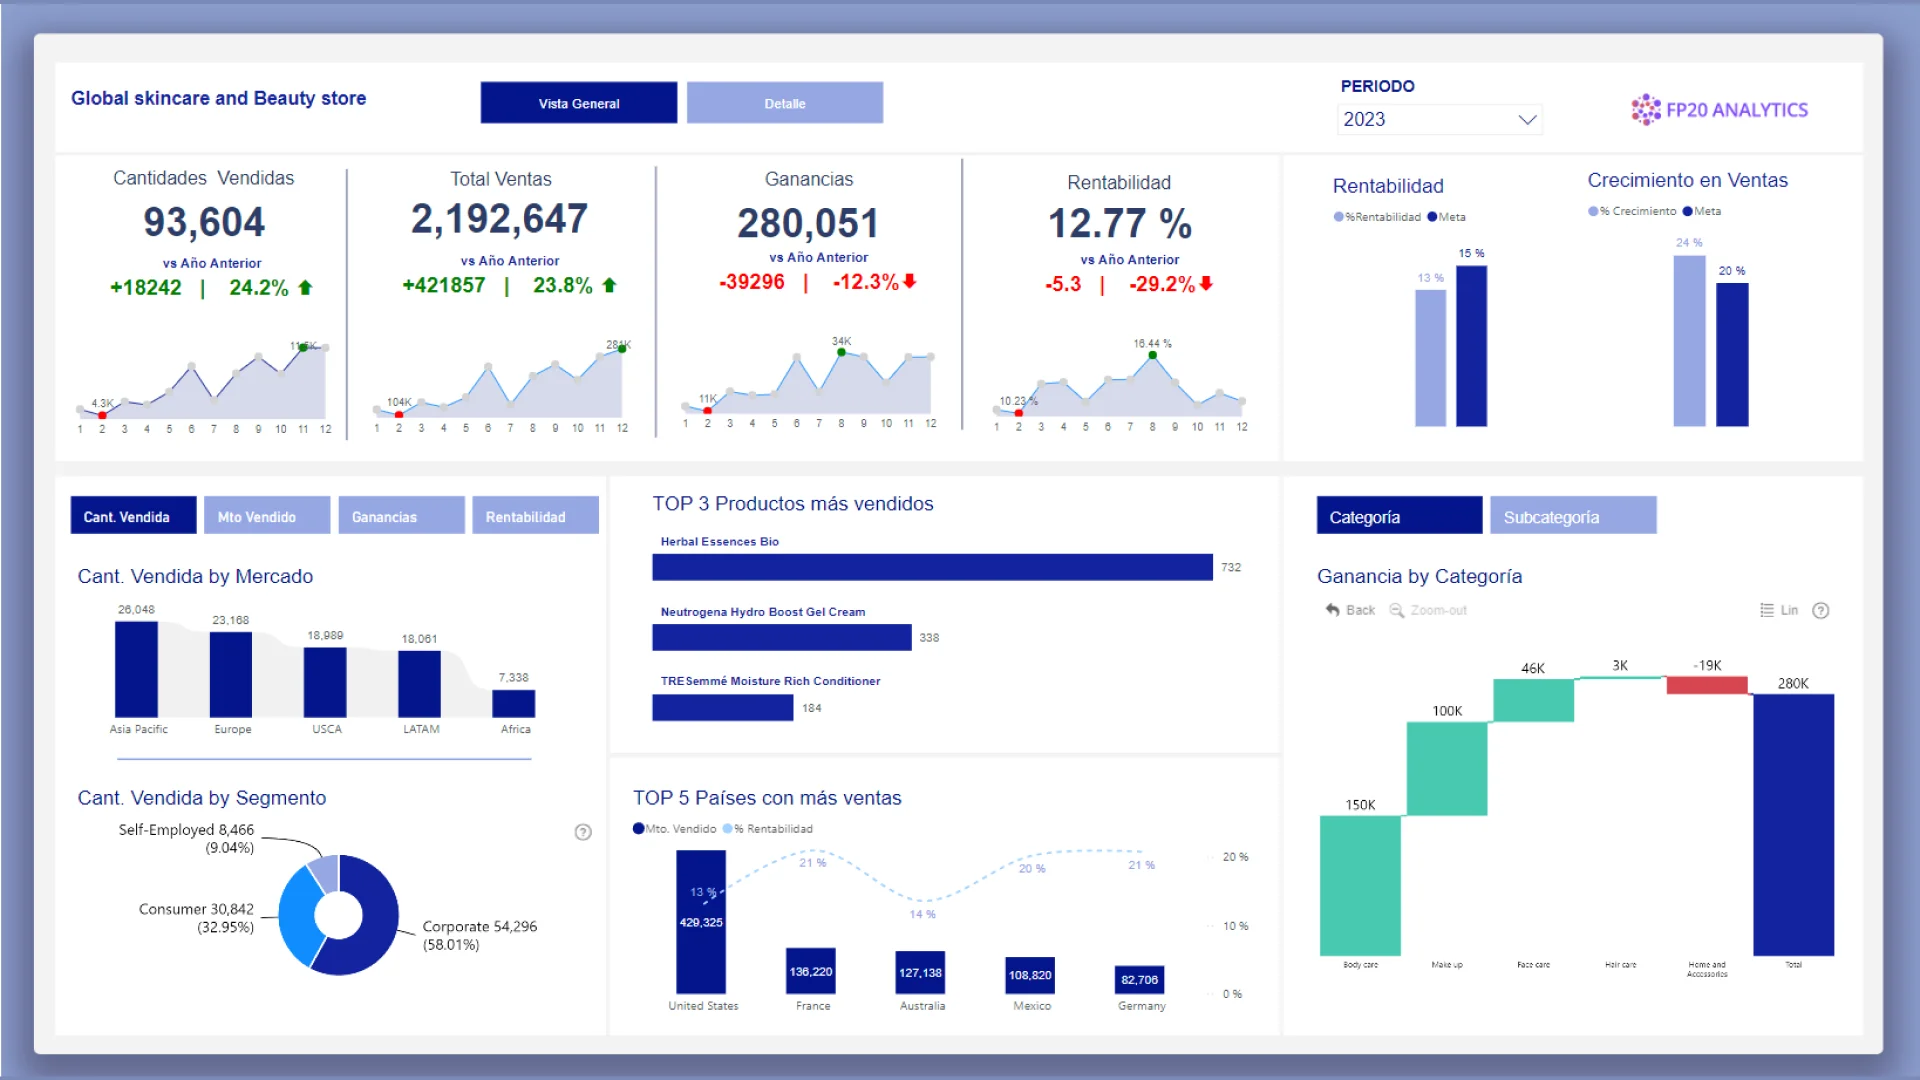
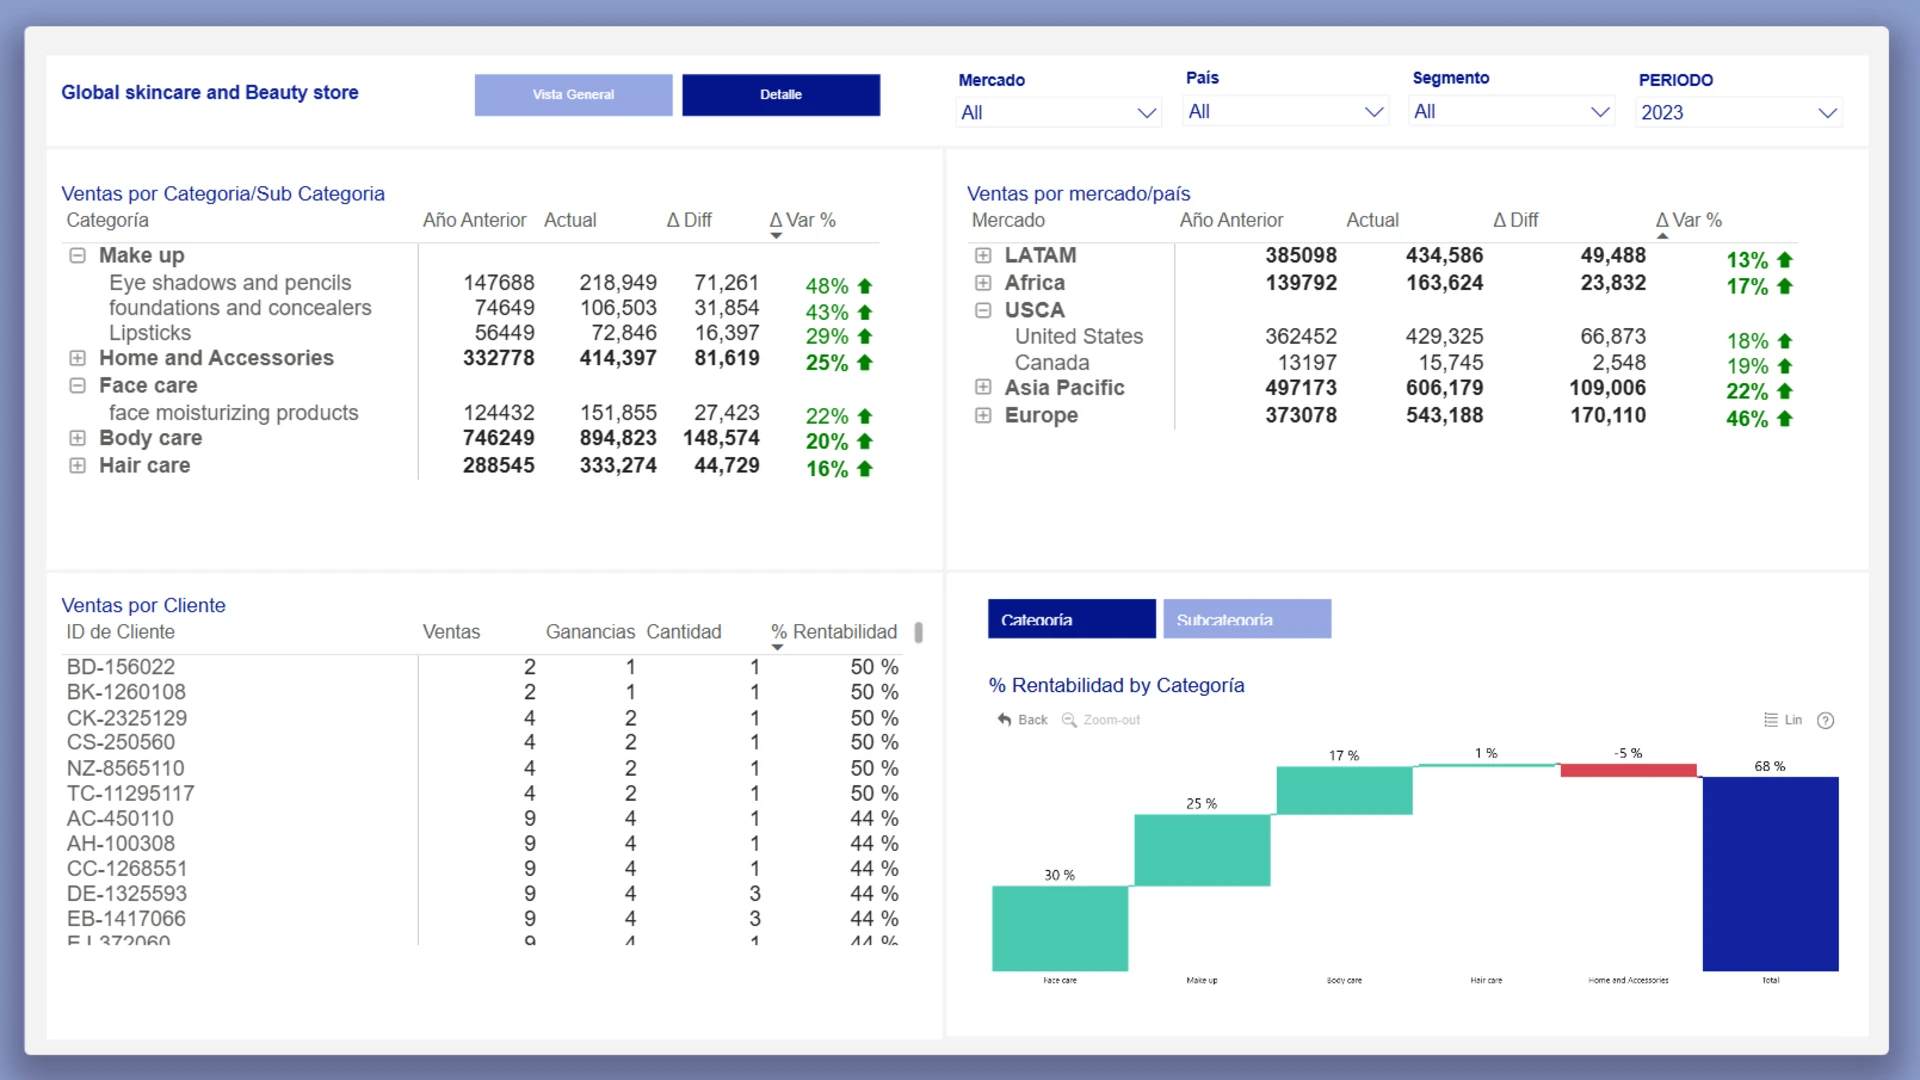
Explore a Power BI waterfall chart dashboard built for ecommerce KPI analysis. This report shows how waterfall charts can break down sales, profit, profitability, and category performance across markets, countries, customer segments, and product categories. Use it as a Power BI waterfall chart example for analyzing what drives ecommerce growth, margin changes, and performance differences between product groups.
Report submitted for FP20 Analytics ZoomCharts Challenge 19 (September 2024). The report was built with the E-commerce KPI Analysis dataset.
4U Report Challenges
Participate in data challenges, build and submit reports to get free template downloads.
Join CommunityMobile view allows you to interact with the report. To Download the template please switch to desktop view.

Was this helpful? Thank you for your feedback!
Sorry about that.
How can we improve it?