1151
Power BI Supply Chain Dashboard
Power BI Supply Chain Dashboard
More Report pages
Report Author: Vic Yao
1151
Share template with others
Summary
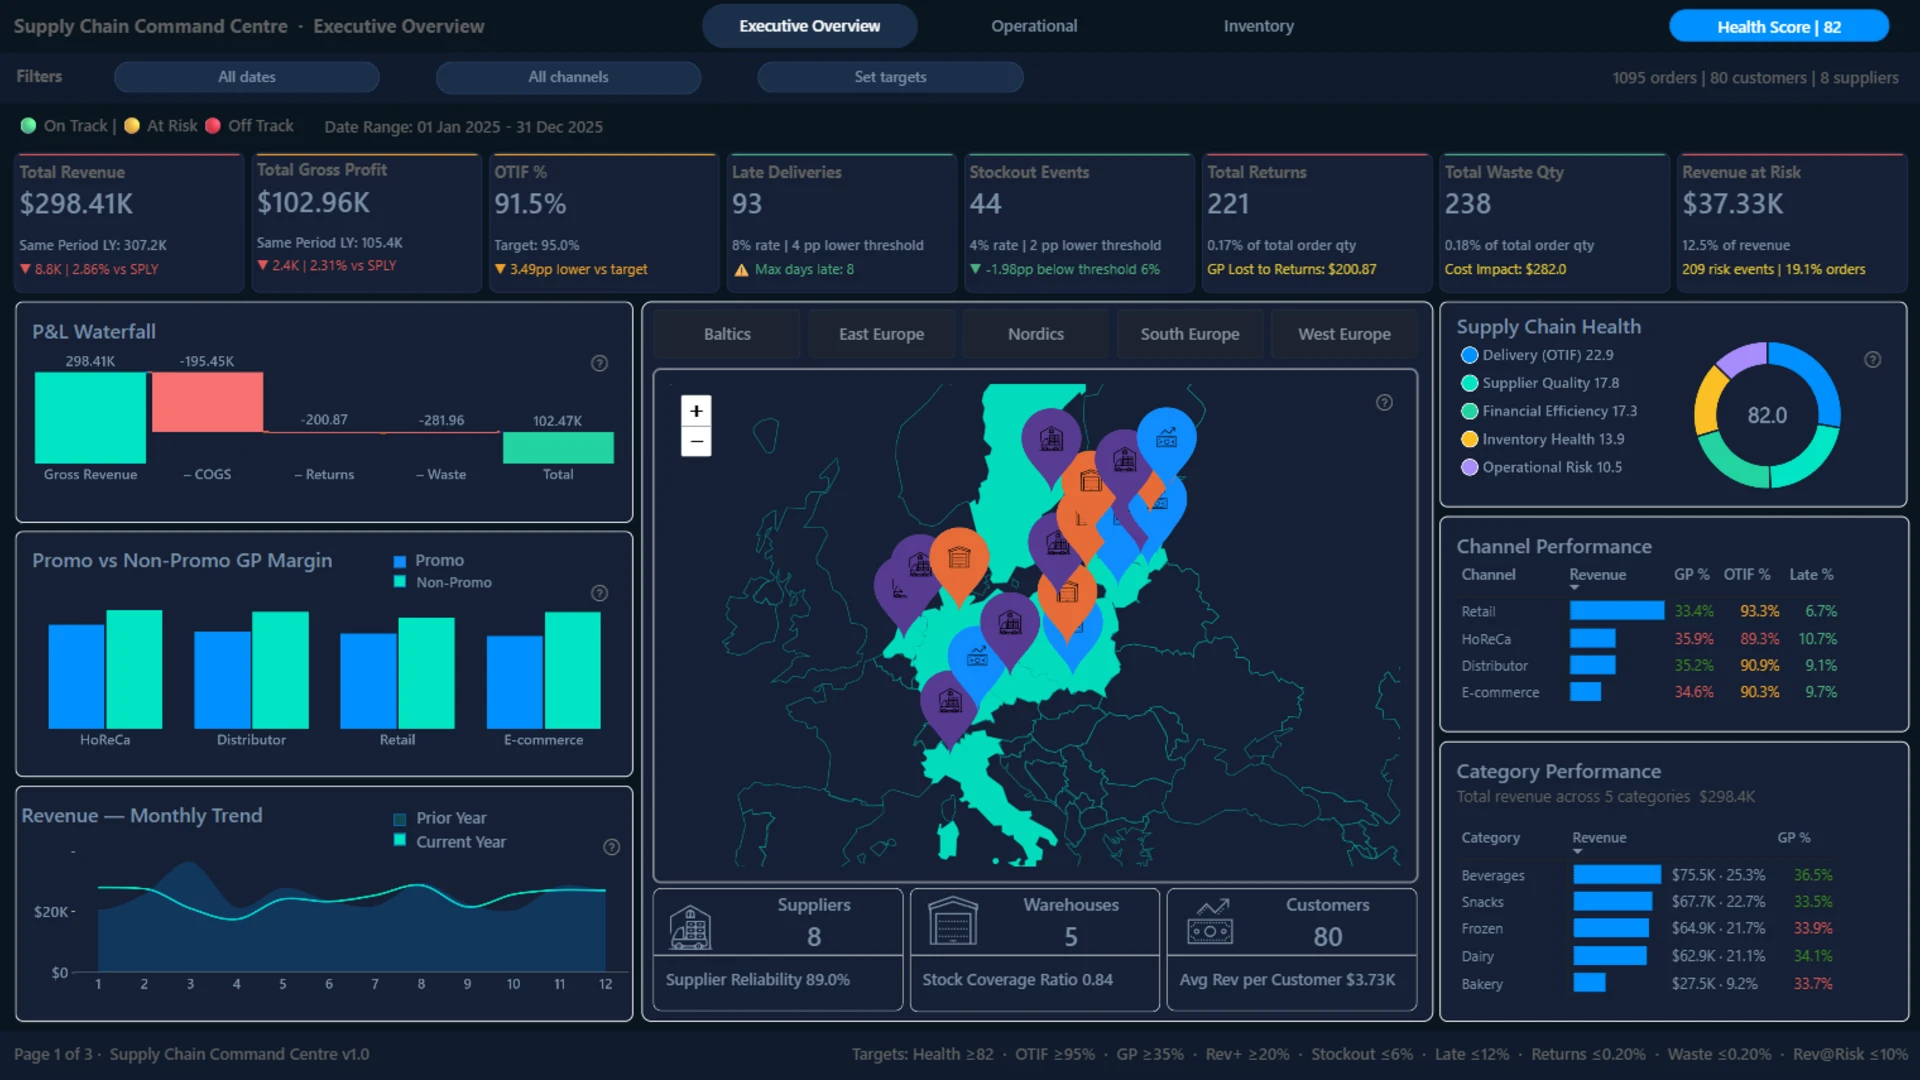
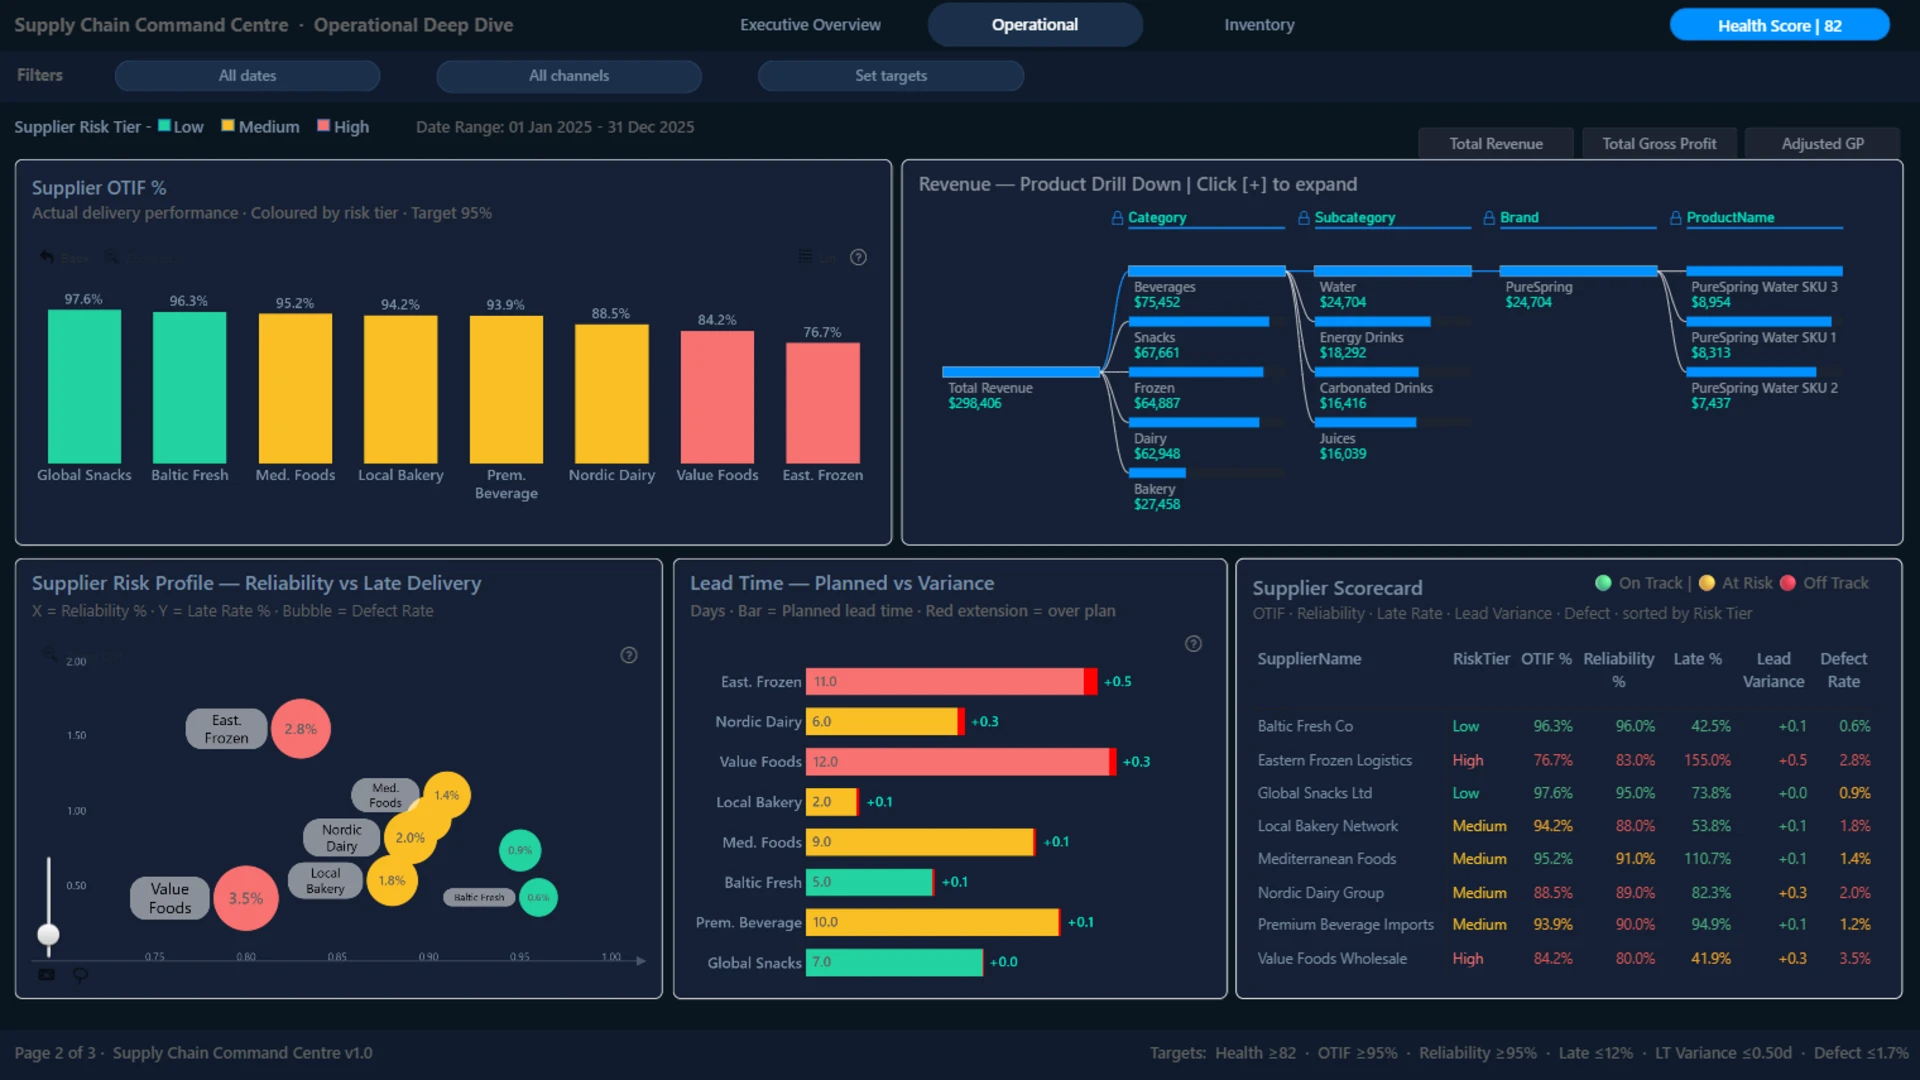
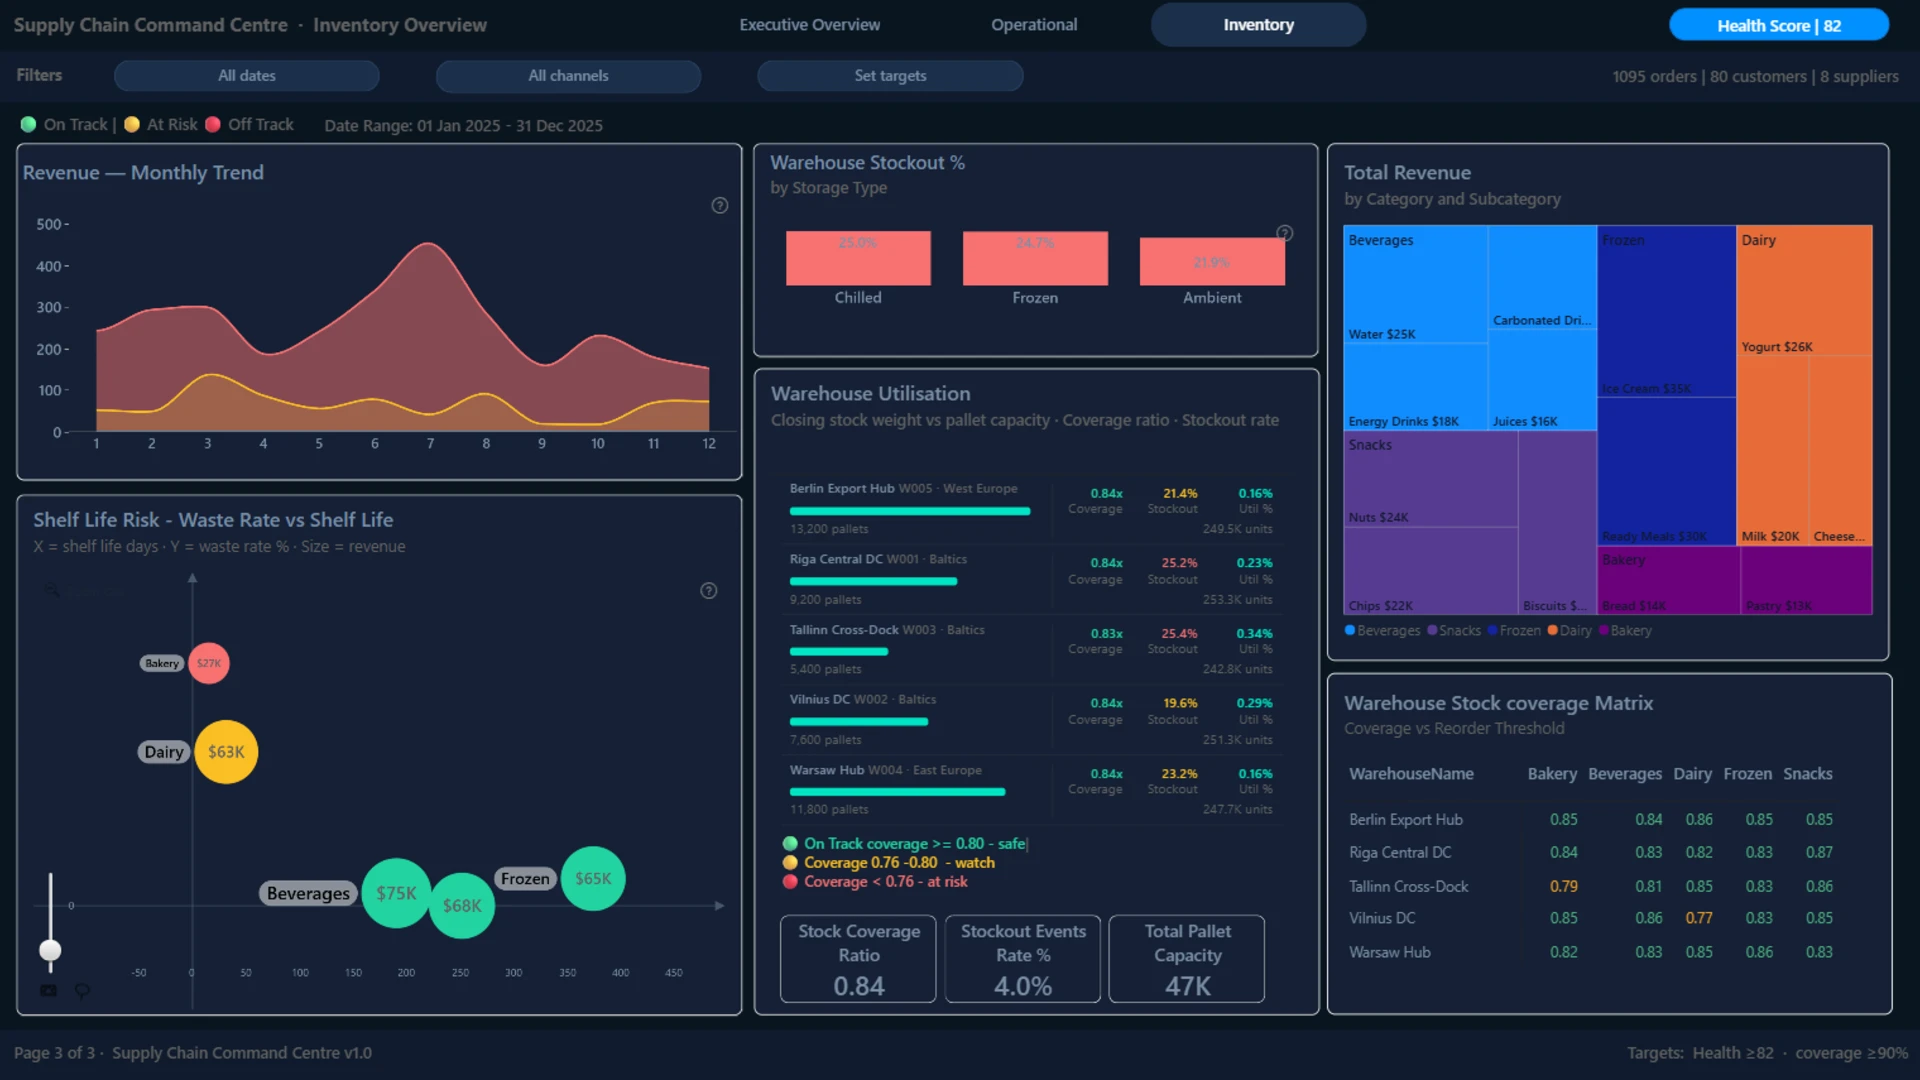
Explore this Power BI supply chain dashboard example for a food and beverage business, built to monitor financial performance, delivery reliability, supplier risk, and inventory health in one interactive report. The dashboard combines executive KPIs with operational and warehouse-level analysis, helping users track revenue, gross profit, OTIF %, late deliveries, stockouts, returns, waste, supplier performance, and stock coverage.
Author’s Description
Designed as a Supply Chain Command Centre, the report includes executive, operational, and inventory views that let users move from high-level supply chain health to detailed insights by region, channel, supplier, warehouse, product category, and time period. It is a practical Power BI report template for analysts and supply chain teams looking for ideas on logistics reporting, inventory monitoring, supplier scorecards, and interactive KPI dashboards.
The report was submitted to the monthly ZoomCharts “4U Reports Challenge” data competition (May 2026).
ZoomCharts visuals used





4U Report Challenges
Participate in data challenges, build and submit reports to get free template downloads.
Join CommunityMobile view allows you to interact with the report. To Download the template please switch to desktop view.
How to use a PBIX template
Preview the interactive report, download the PBIX file, open it in Power BI Desktop, and replace the same data connection with your own dataset.
Preview and download
Explore the report online and download the PBIX template file.
Open in Power BI Desktop
Open the downloaded PBIX file in Power BI Desktop.
Connect your data
Replace the sample data source with your own dataset.
Refresh and adjust
Refresh the model and update fields or visual were needed.
Save and share
Save your report and publish it for your audience.


