909
Power BI Revenue and Profitability Dashboard
Power BI Revenue and Profitability Dashboard
More Report pages
Report Author: Alani Joshua
909
Share template with others
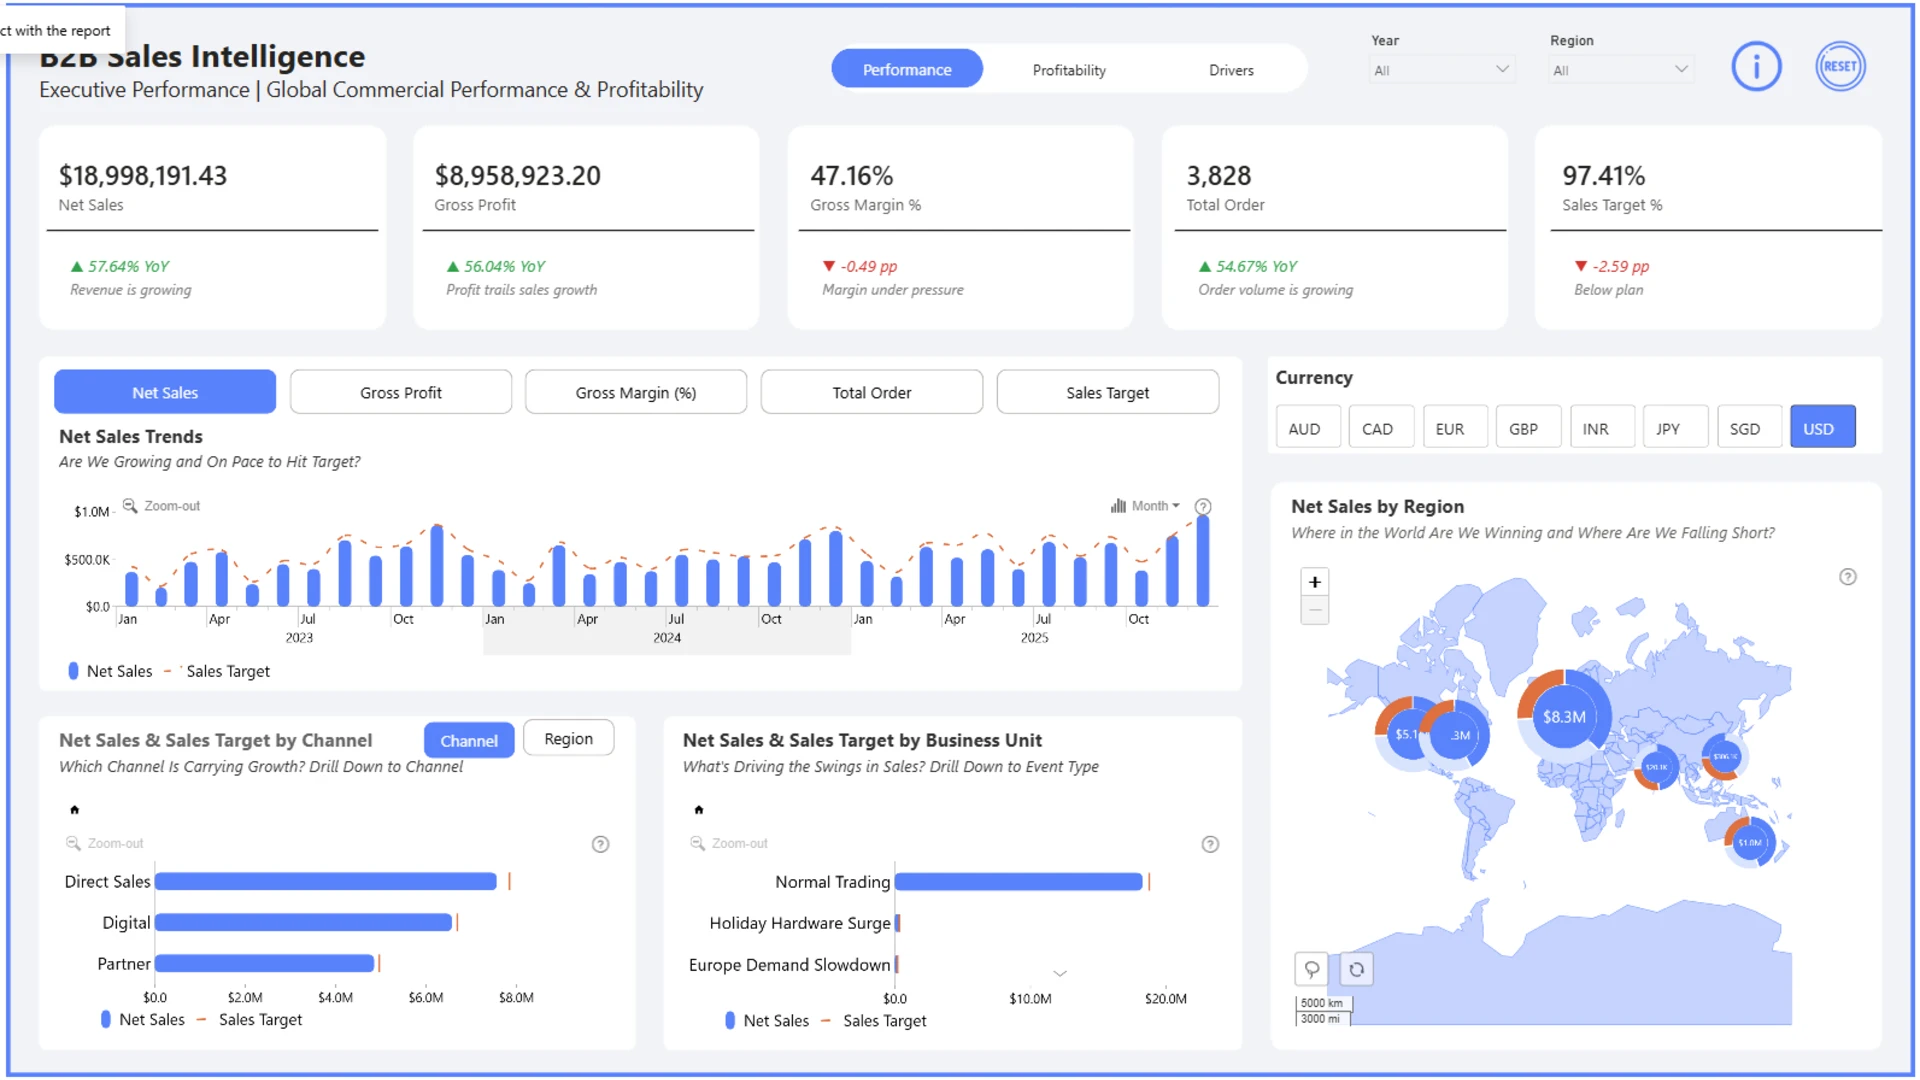
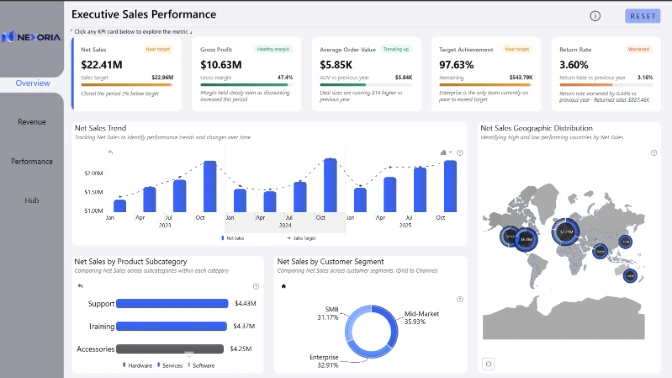
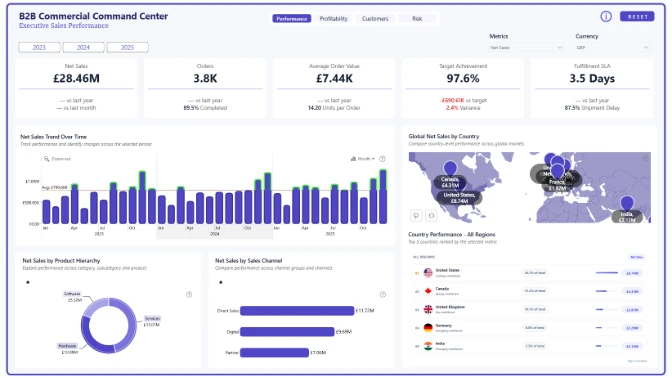
This Power BI Revenue & Profitability Dashboard connects sales performance with costs, gross profit, margins, targets, and returns to provide a comprehensive view of global B2B performance. It helps identify where the business is performing strongly, where profitability is coming from, and which areas may require closer attention.
The report was submitted to the ZoomCharts 4U Report Challenge August 2026 and combines Power BI with ZoomCharts Drill Down visuals to support interactive exploration of B2B sales performance.
Author’s Description
A three-page Power BI report analyzing 6,000 B2B sales records across North America, Europe, and Asia Pacific. The report follows a clear executive narrative, moving from overall performance to profitability and, finally, the drivers behind business results.
Page 1: Performance
Answers “Are we winning?” by presenting key KPIs, monthly sales trends, target achievement, and regional and channel performance.
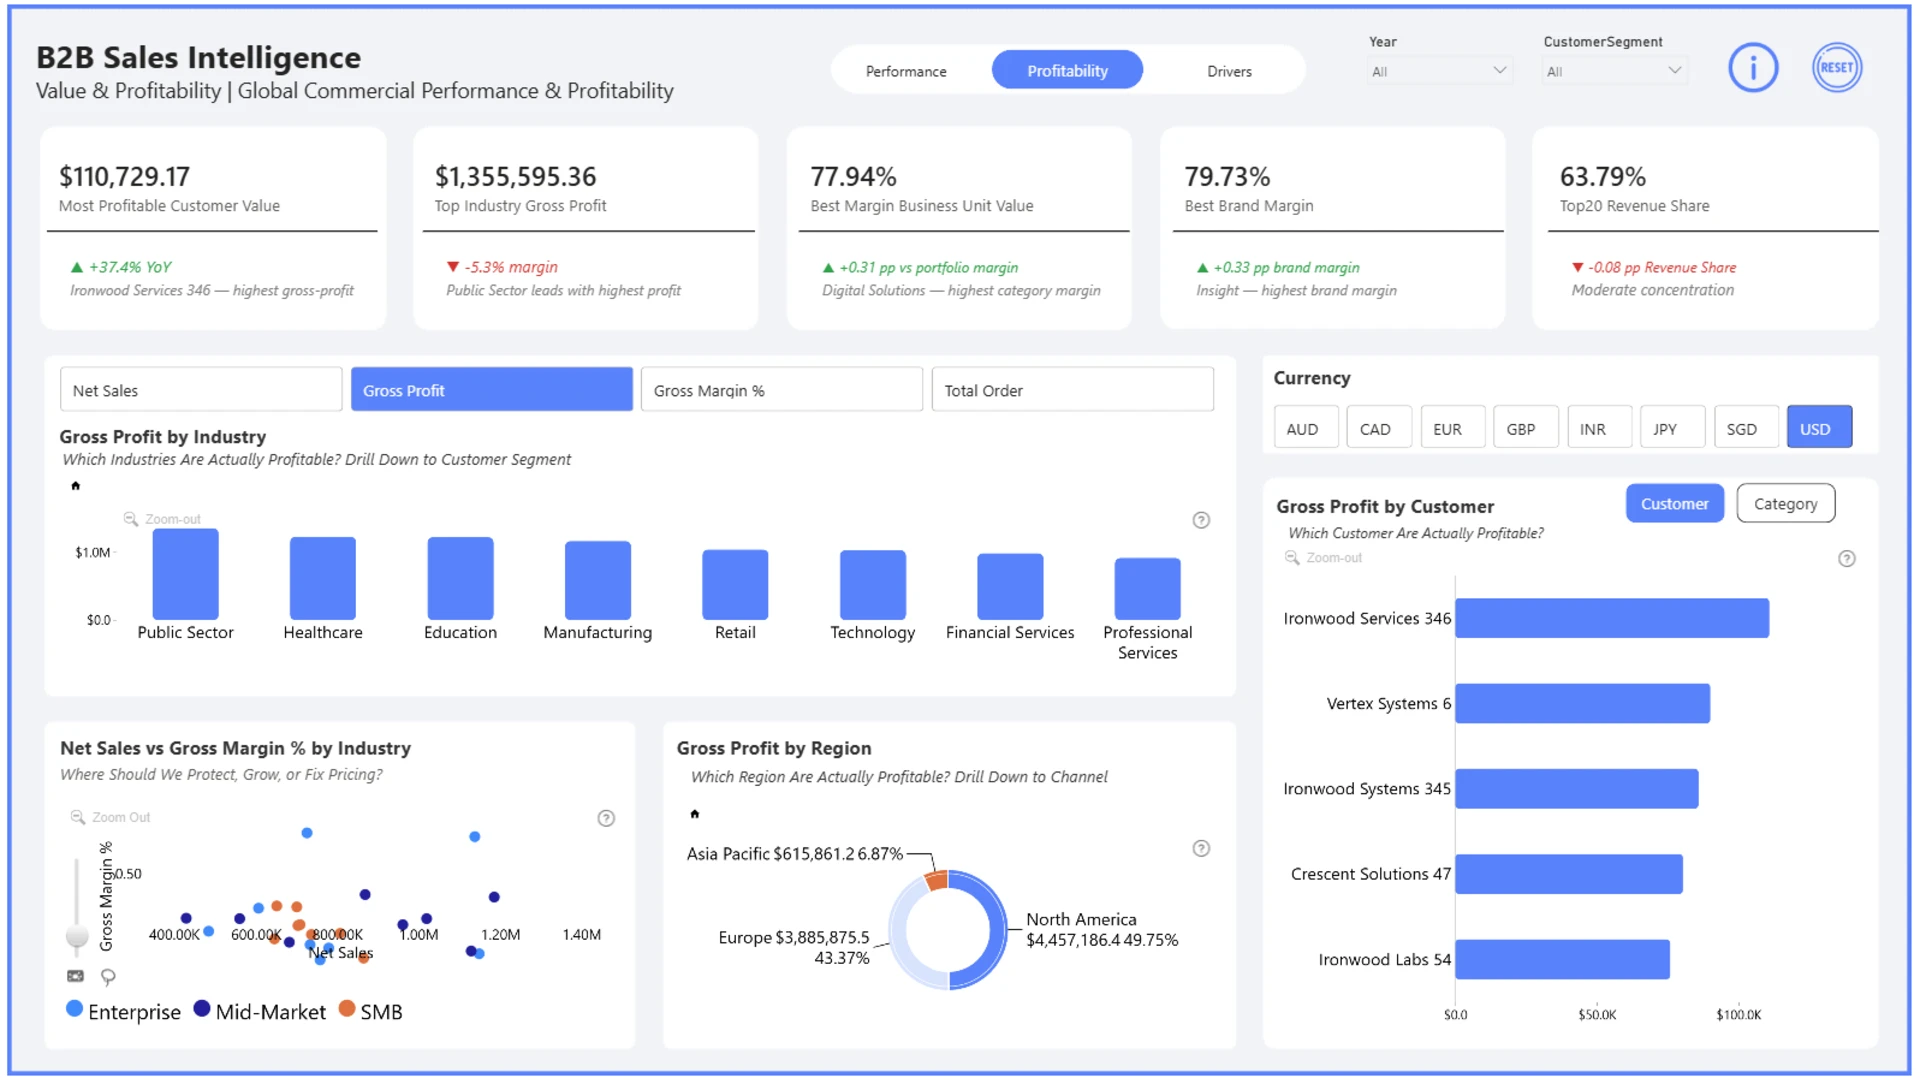
Page 2: Profitability
Identifies who and what generates real business value by looking beyond revenue to analyze gross profit, margins, concentration risk, and product profitability.
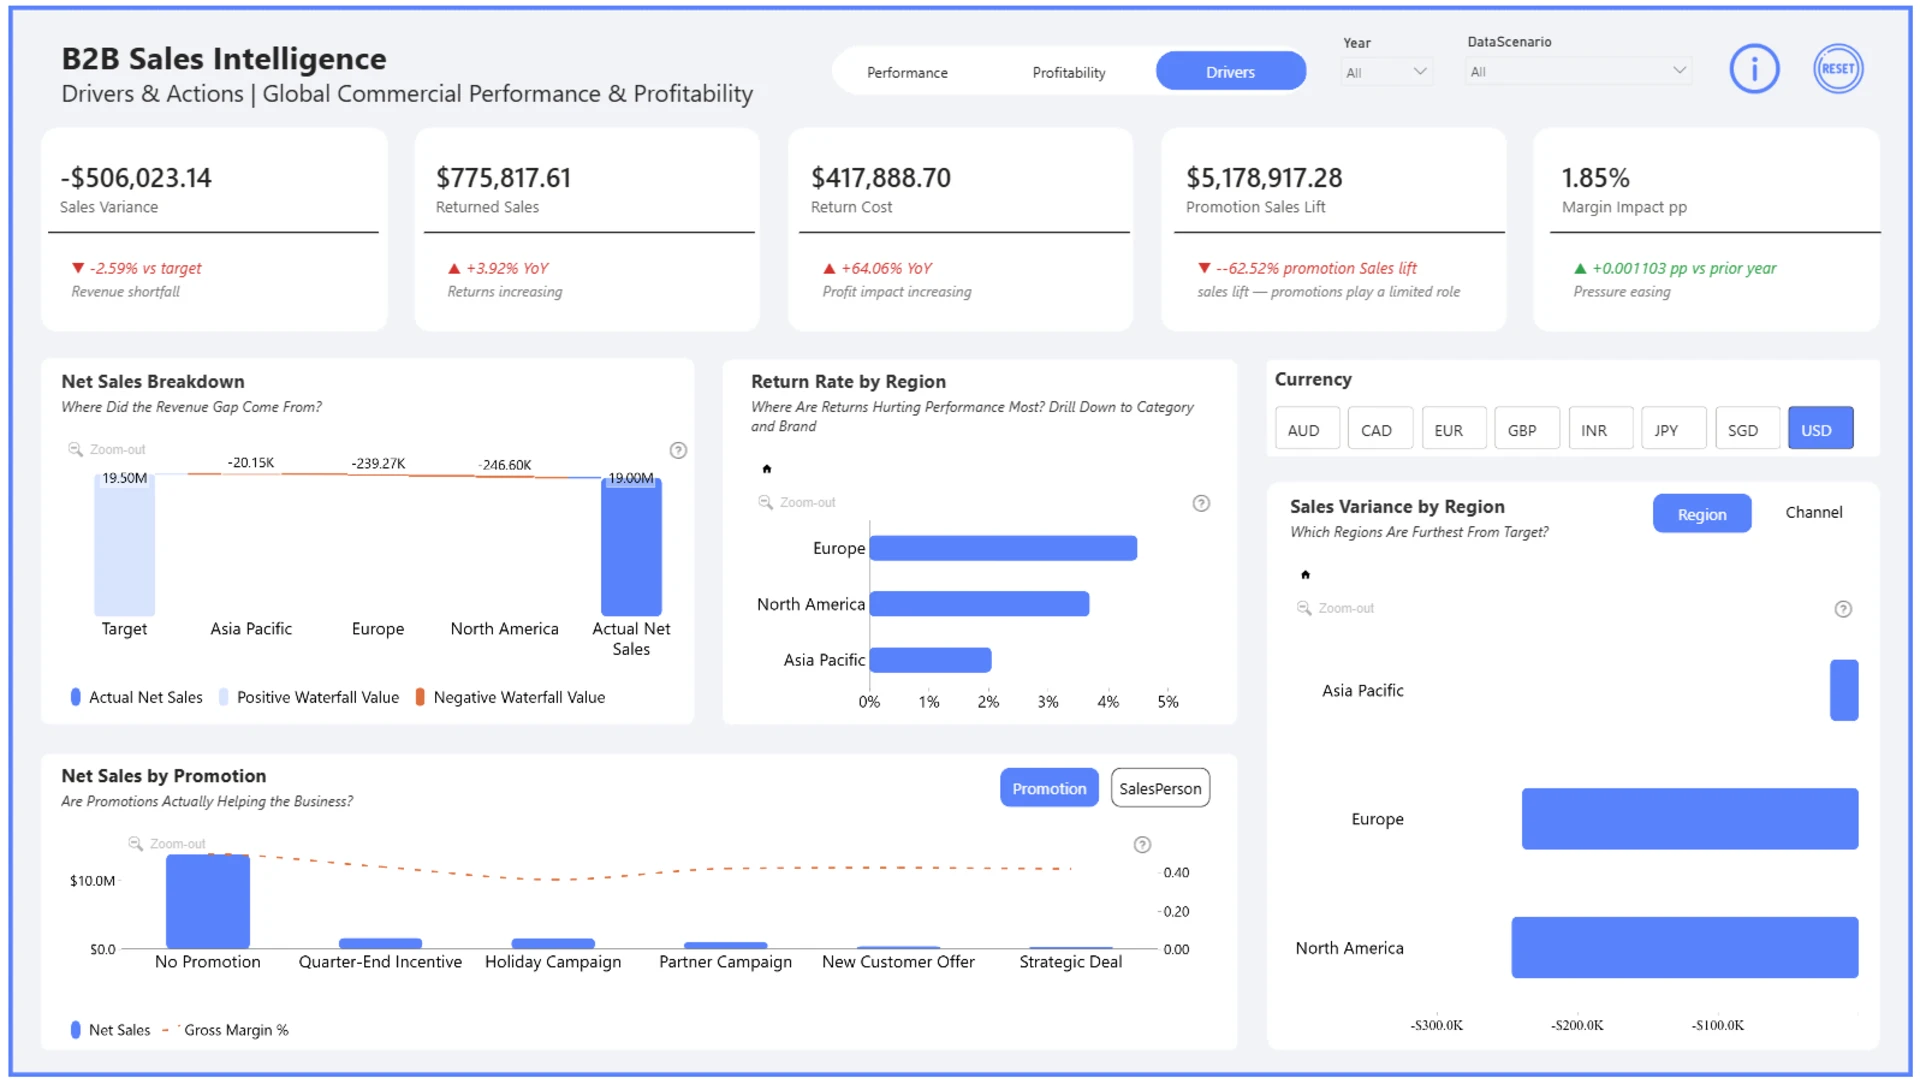
Page 3: Drivers & Actions
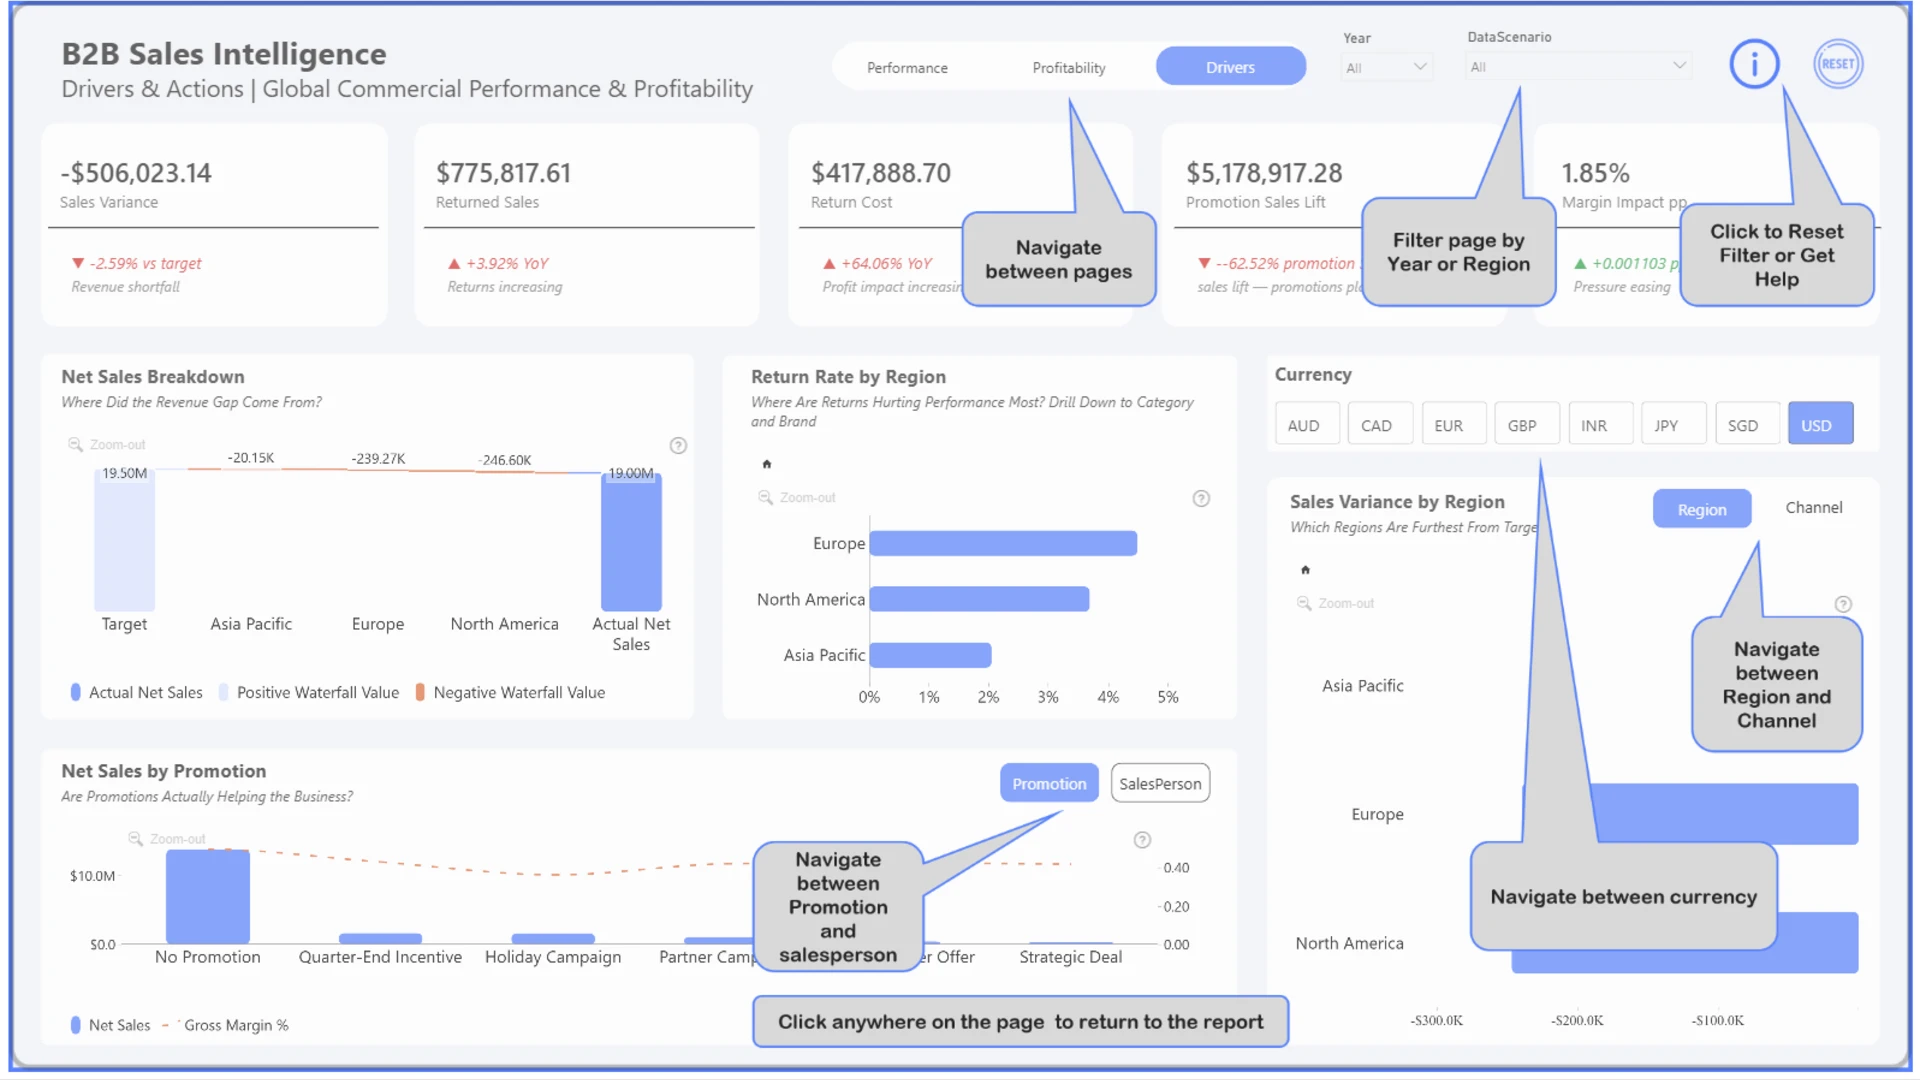
Explains why results changed using revenue variance analysis, return costs, and promotion effectiveness to uncover key performance drivers and potential root causes.
The report is fully interactive across all three pages. A dynamic currency parameter allows users to view financial figures in eight currencies, with automatic symbol and format switching. Synced Year, Region, and Scenario slicers enable consistent cross-filtering throughout the report, while DAX-driven insight sentences update dynamically to explain what the data shows at any selected filter state.
ZoomCharts visuals used







4U Report Challenges
Participate in data challenges, build and submit reports to get free template downloads.
Join CommunityMobile view allows you to interact with the report. To Download the template please switch to desktop view.
How to use a PBIX template
Preview the interactive report, download the PBIX file, open it in Power BI Desktop, and replace the same data connection with your own dataset.
Preview and download
Explore the report online and download the PBIX template file.
Open in Power BI Desktop
Open the downloaded PBIX file in Power BI Desktop.
Connect your data
Replace the sample data source with your own dataset.
Refresh and adjust
Refresh the model and update fields or visual were needed.
Save and share
Save your report and publish it for your audience.


