951
Power BI Project Management Dashboard for Portfolio Performance
Power BI Project Management Dashboard for Portfolio Performance
More Report pages
Report Author: ZoomCharts
951
Share template with others
Summary
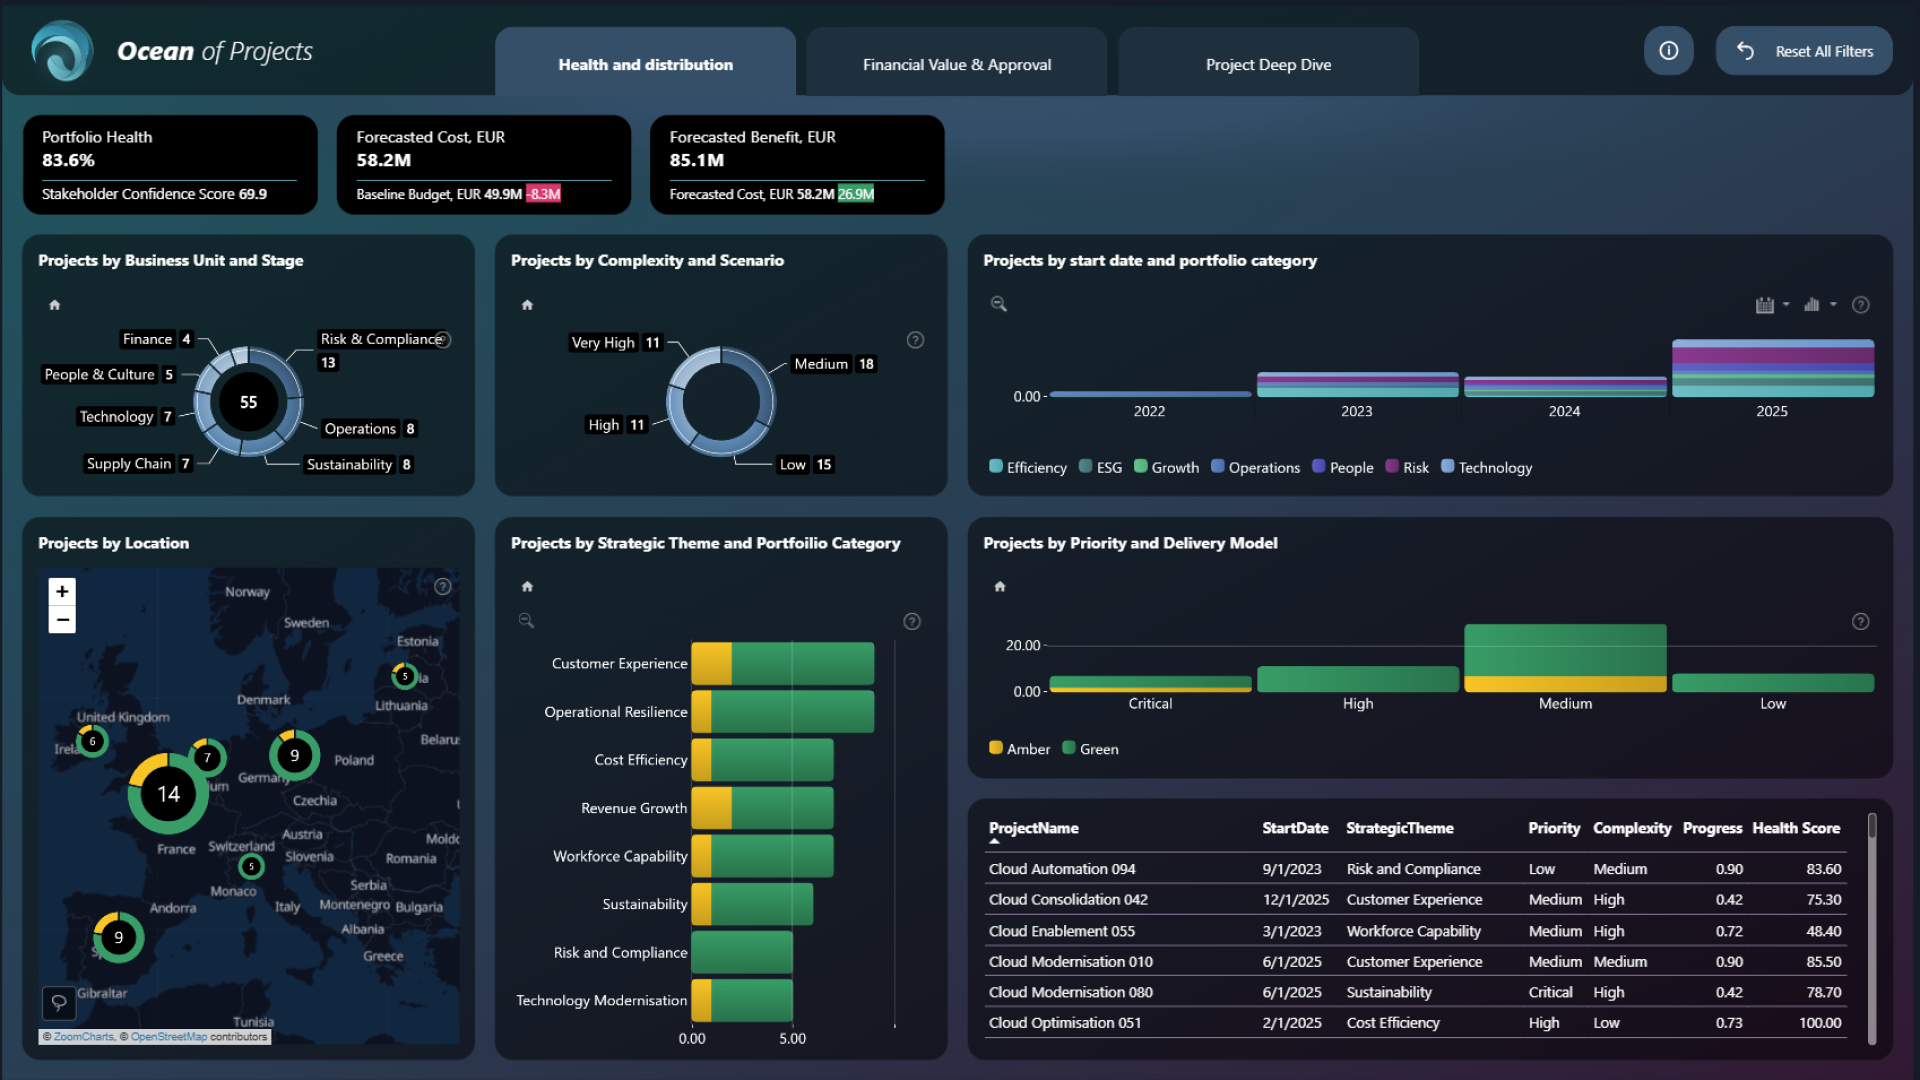
This Power BI project management dashboard gives project managers, PMO teams, analysts, and executives a clear view of project portfolio health, financial performance, delivery progress, risks, and expected benefits.
Designed as an interactive project portfolio management dashboard, it combines a high-level portfolio overview with detailed financial analysis and individual project tracking. Users can quickly see how projects are performing, where costs or risks are increasing, and which areas need closer attention.
Key Insights of This Power BI Project Management Dashboard
The report is structured across three pages, moving from portfolio-level monitoring to financial analysis and a detailed project view. Some of the main insights include:
- Project portfolio health: monitor overall portfolio health, stakeholder confidence, forecasted costs, expected benefits, and project distribution.
- Project distribution: analyze projects by business unit, lifecycle stage, complexity, strategic theme, portfolio category, priority, delivery model, and location.
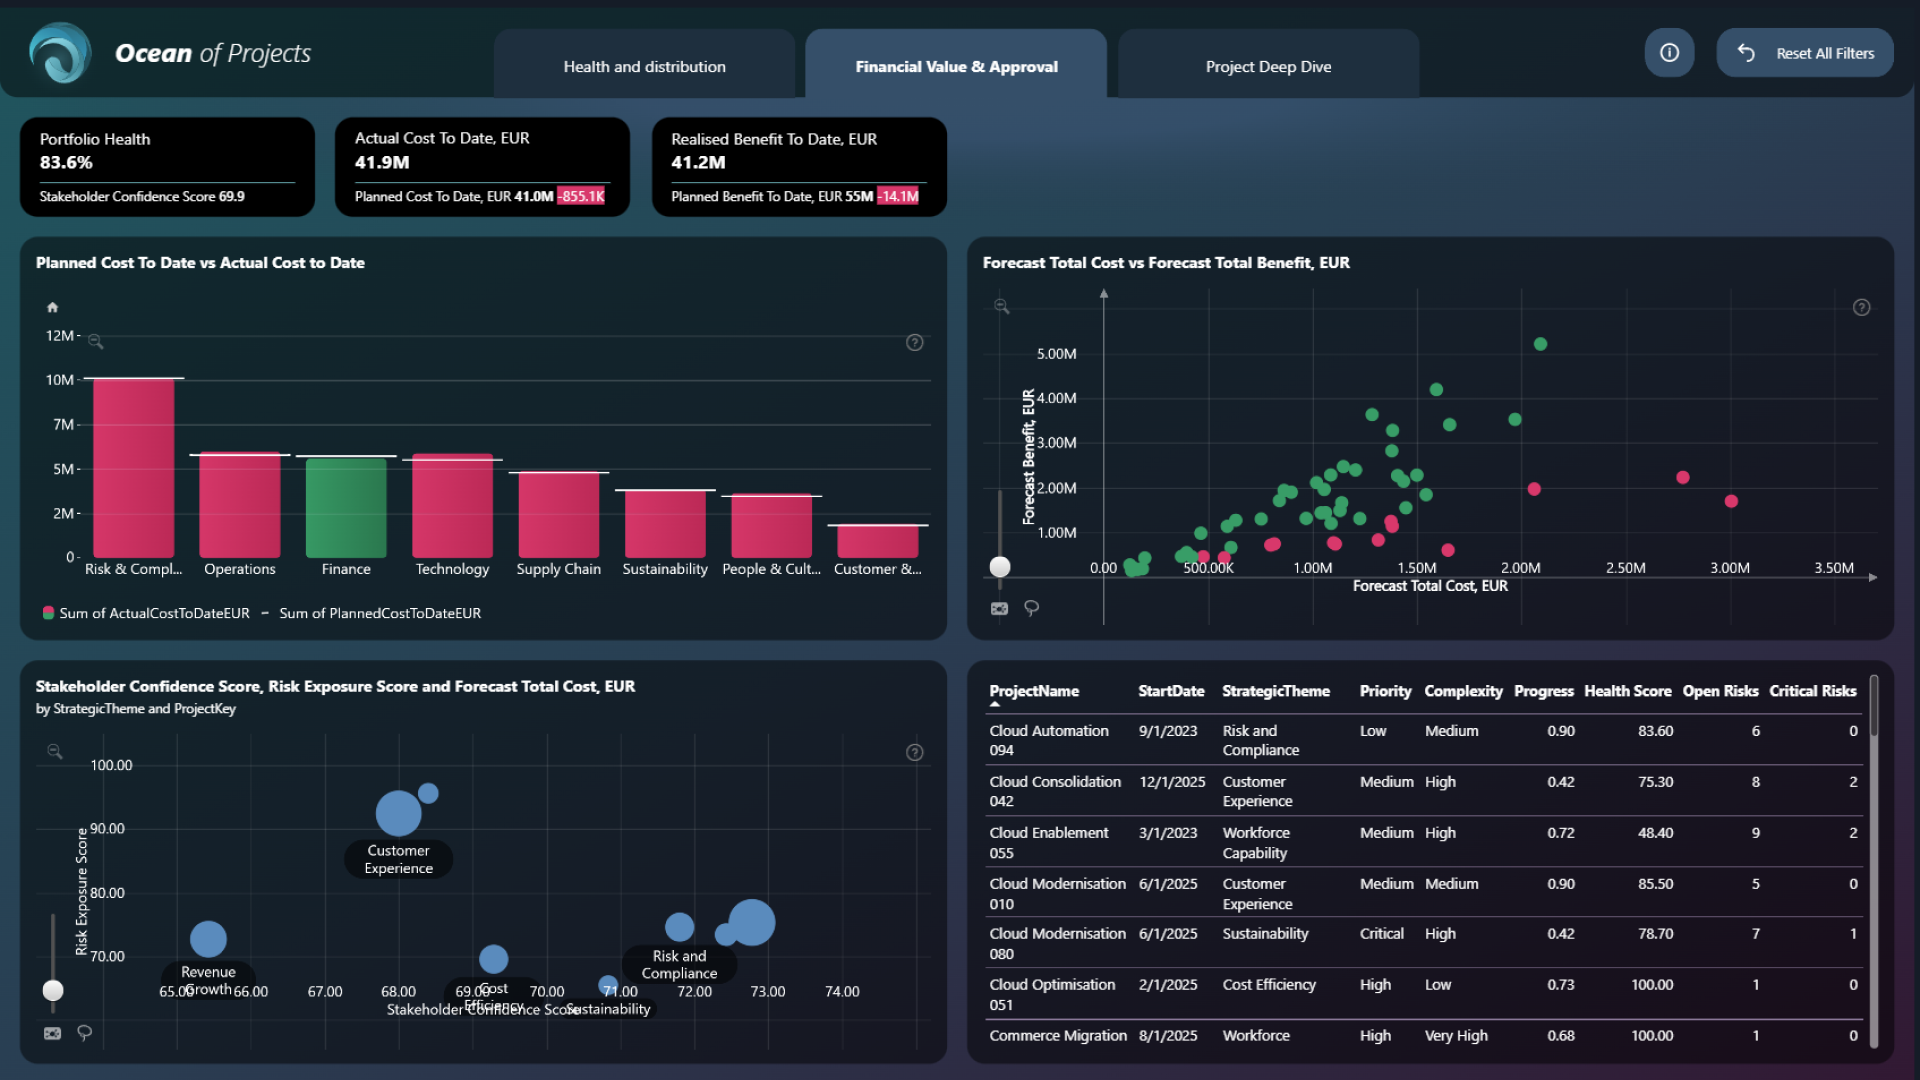
- Financial performance: compare planned and actual costs, track realized benefits, and evaluate forecasted project cost against expected benefit.
- Project risk: explore risk exposure, open risks, critical risks, stakeholder confidence, and project health across the portfolio.
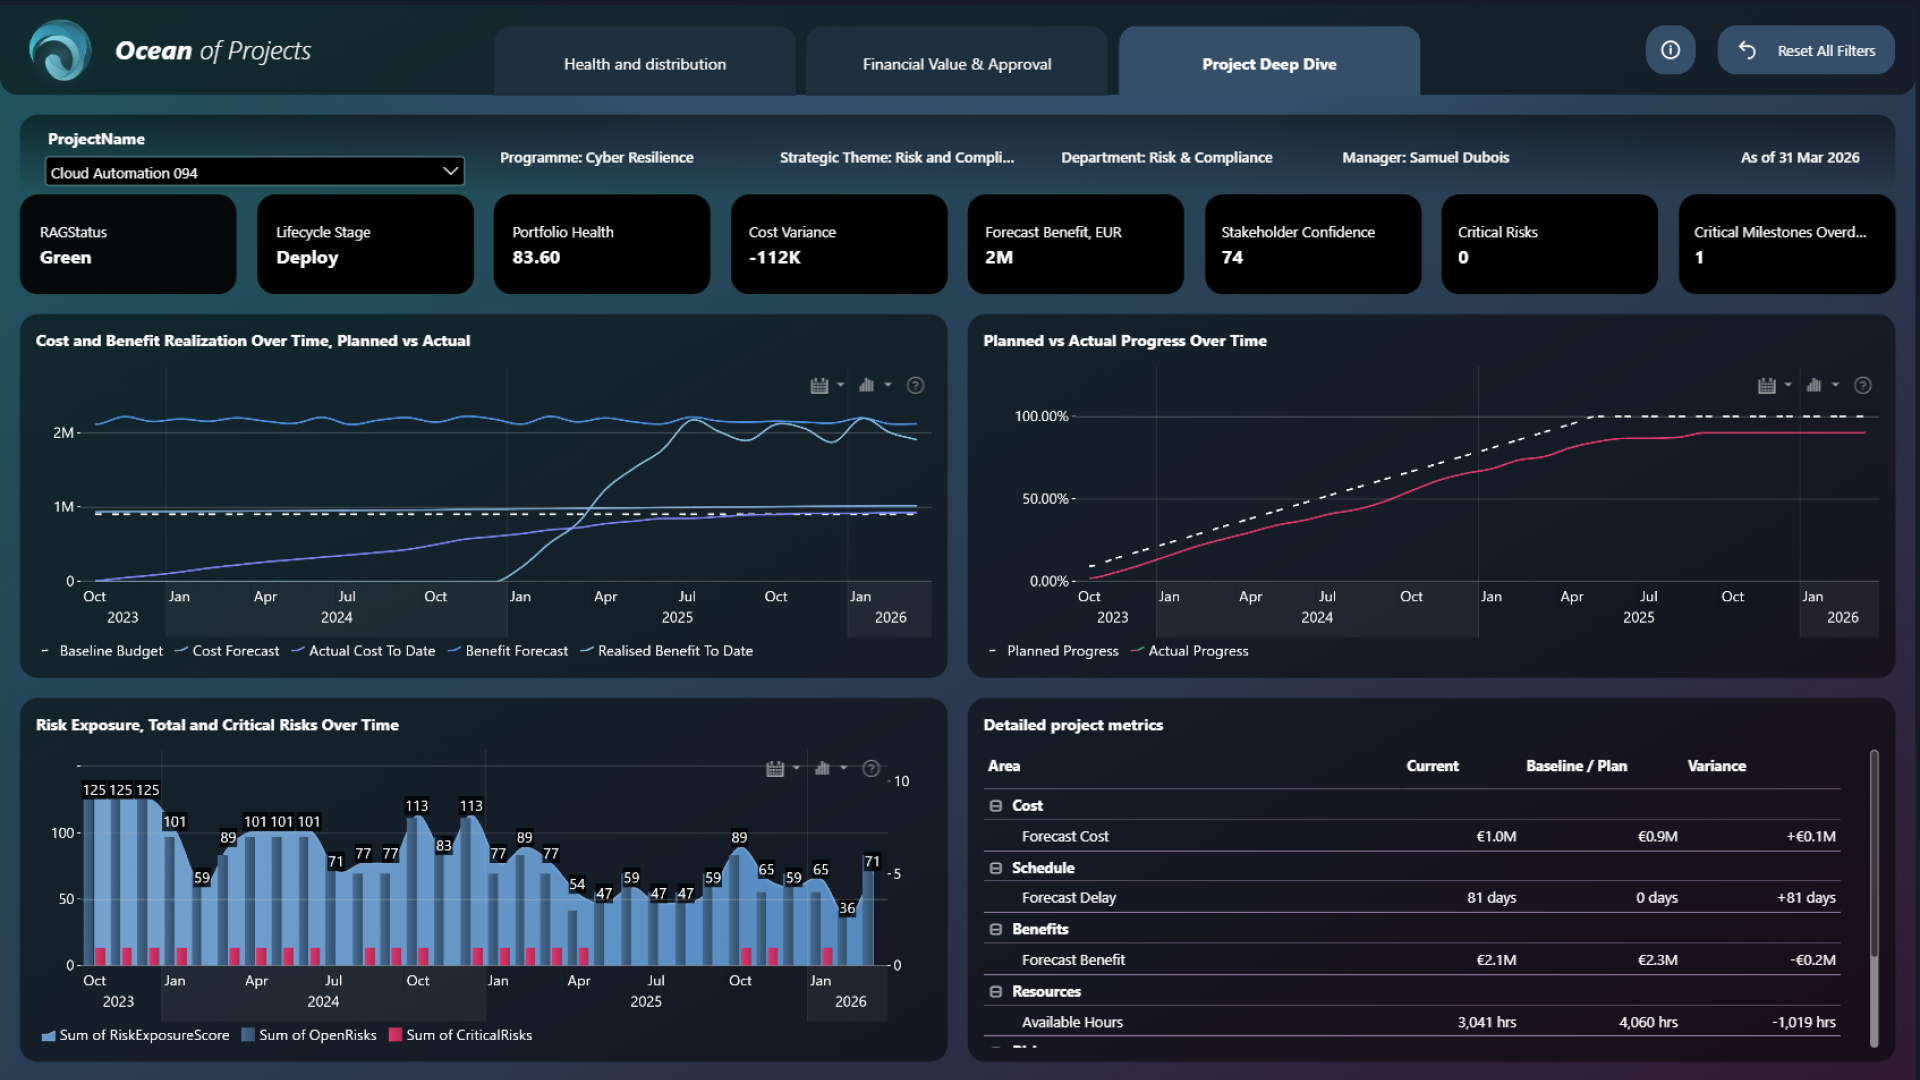
- Delivery progress: compare planned and actual project progress over time and identify delays or performance gaps.
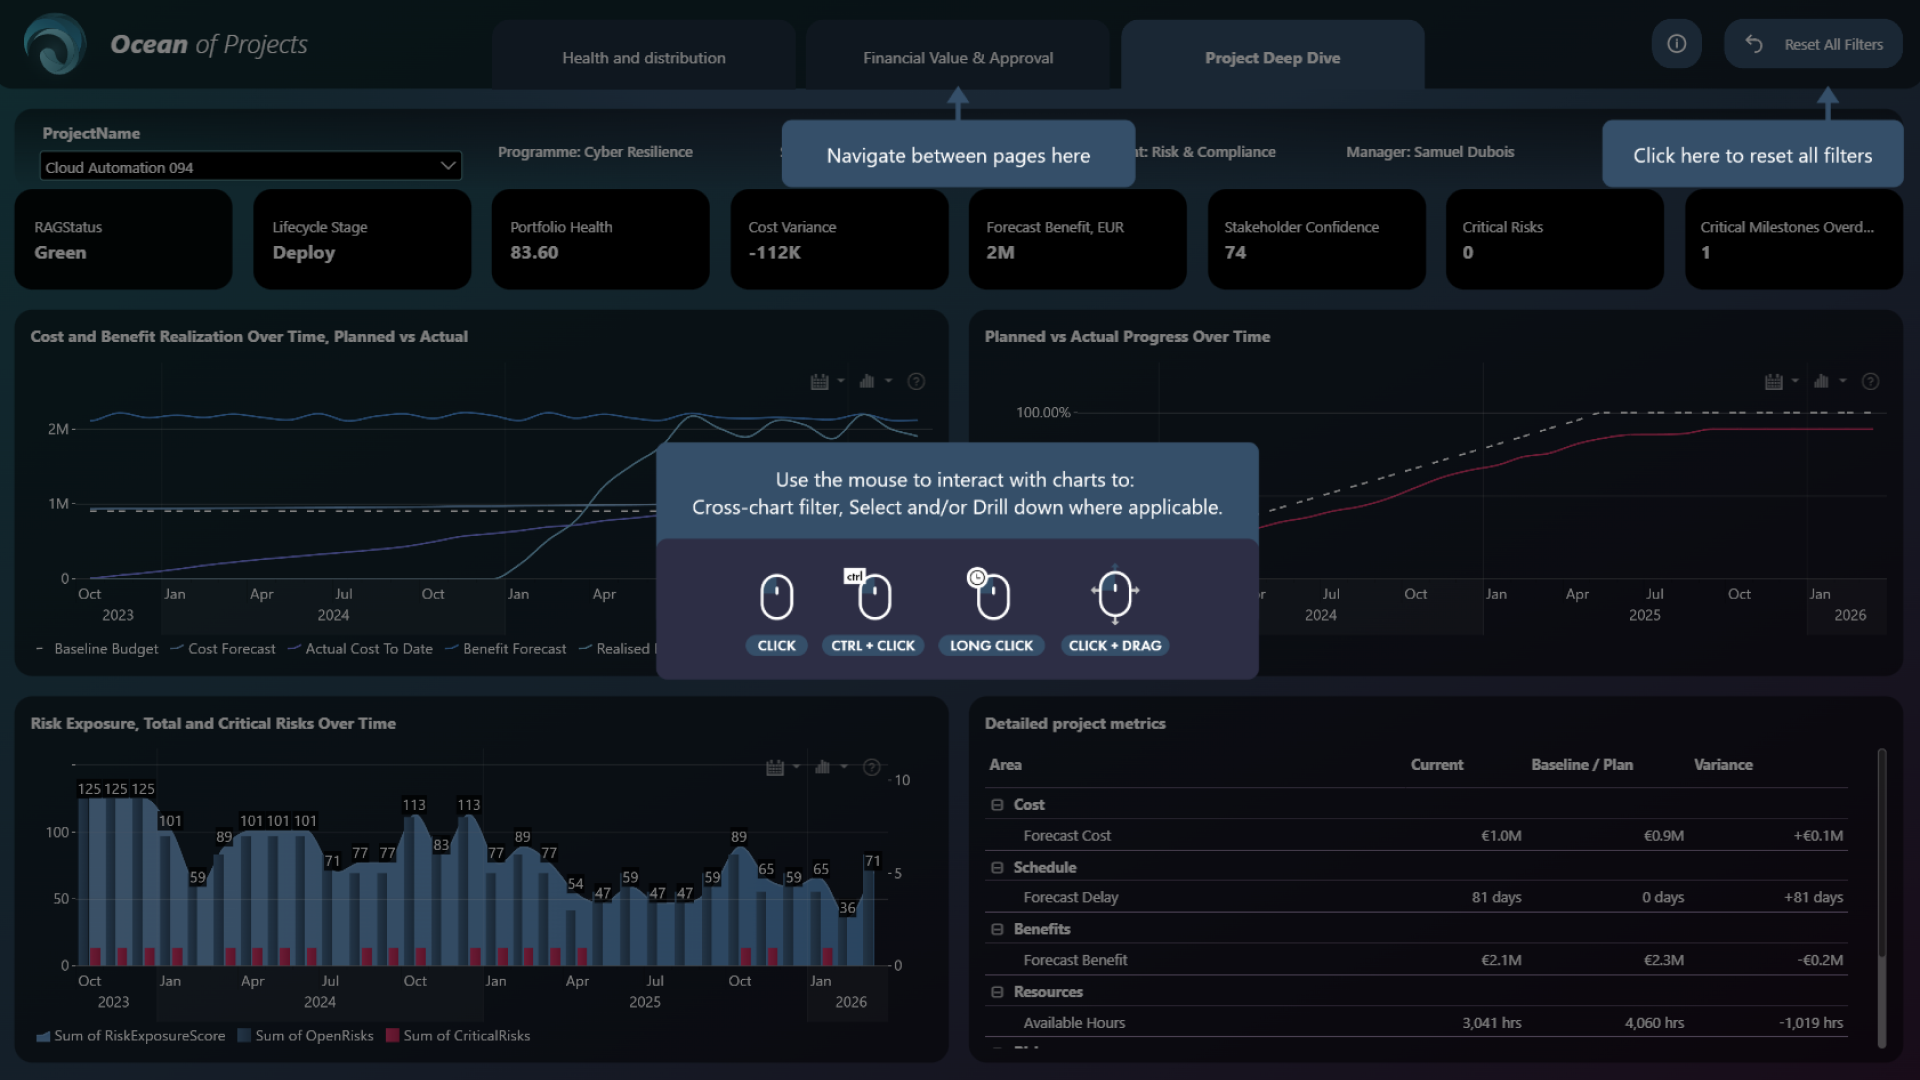
- Project deep dive: select an individual project to review its status, lifecycle stage, cost variance, forecast benefit, critical risks, overdue milestones, schedule, resources, and other detailed project metrics.
The interactive visuals make it easy to move from the overall project portfolio to specific business areas or individual projects. Cross-filtering and drill-down interactions help users understand what is driving changes in cost, benefit, progress, and risk without switching between separate reports.
How to Use This Power BI Project Management Dashboard
Use the navigation at the top of the report to move between Health and Distribution, Financial Value & Approval, and Project Deep Dive. Click active chart elements to filter and explore related project data across the page.
On the Project Deep Dive page, select a project to review its financial performance, progress, risk history, benefits, schedule, resources, and current project status. Use the Reset All Filters button to return to the full portfolio view.
Download the .pbix file to explore the report structure, calculations, visual settings, and interactions in Power BI Desktop. You can then connect the template to your own project portfolio or PMO data and adapt it to your reporting needs.
ZoomCharts visuals used







4U Report Challenges
Participate in data challenges, build and submit reports to get free template downloads.
Join CommunityMobile view allows you to interact with the report. To Download the template please switch to desktop view.



How to use a PBIX template
Preview the interactive report, download the PBIX file, open it in Power BI Desktop, and replace the same data connection with your own dataset.
Preview and download
Explore the report online and download the PBIX template file.
Open in Power BI Desktop
Open the downloaded PBIX file in Power BI Desktop.
Connect your data
Replace the sample data source with your own dataset.
Refresh and adjust
Refresh the model and update fields or visual were needed.
Save and share
Save your report and publish it for your audience.


