1962
Power BI Procurement Spend Dashboard
Power BI Procurement Spend Dashboard
More Report pages
Report Author: Nina Ikpe
1962
Share template with others
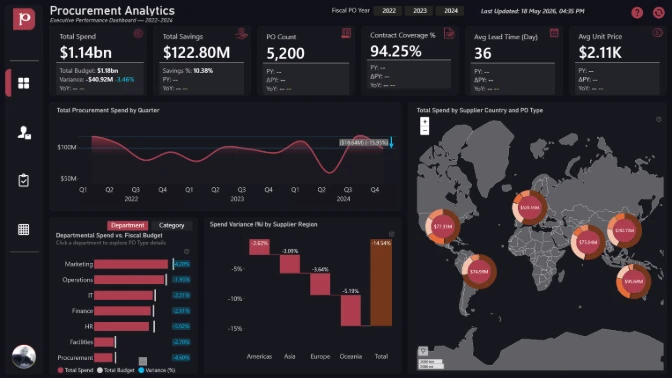
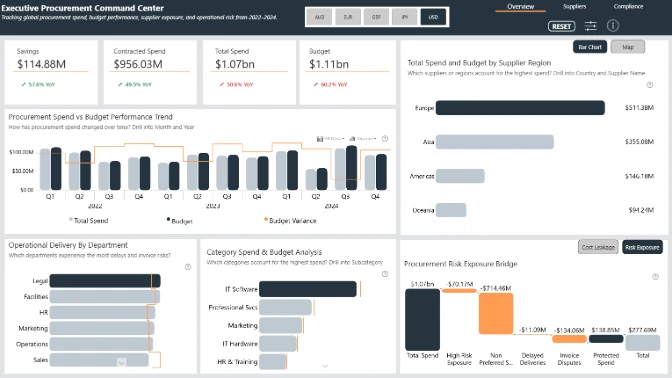
This interactive Power BI report explores the Procurement dataset using ZoomCharts Drill Down custom visuals and native Power BI visuals. It analyzes purchase order activity from 2022 to 2024, highlighting procurement spend, supplier performance, budget versus actuals, savings, delivery timelines, supplier risk, and maverick spend across categories, departments, regions, and suppliers.
The report helps users identify spending trends, compare supplier performance, monitor compliance, evaluate budget pressure, and uncover opportunities to improve procurement efficiency, reduce risk, and support better purchasing decisions.
The report was submitted to the FP20 Analytics ZoomCharts Data Challenge 37 (April-May 2026).
Author’s Description:
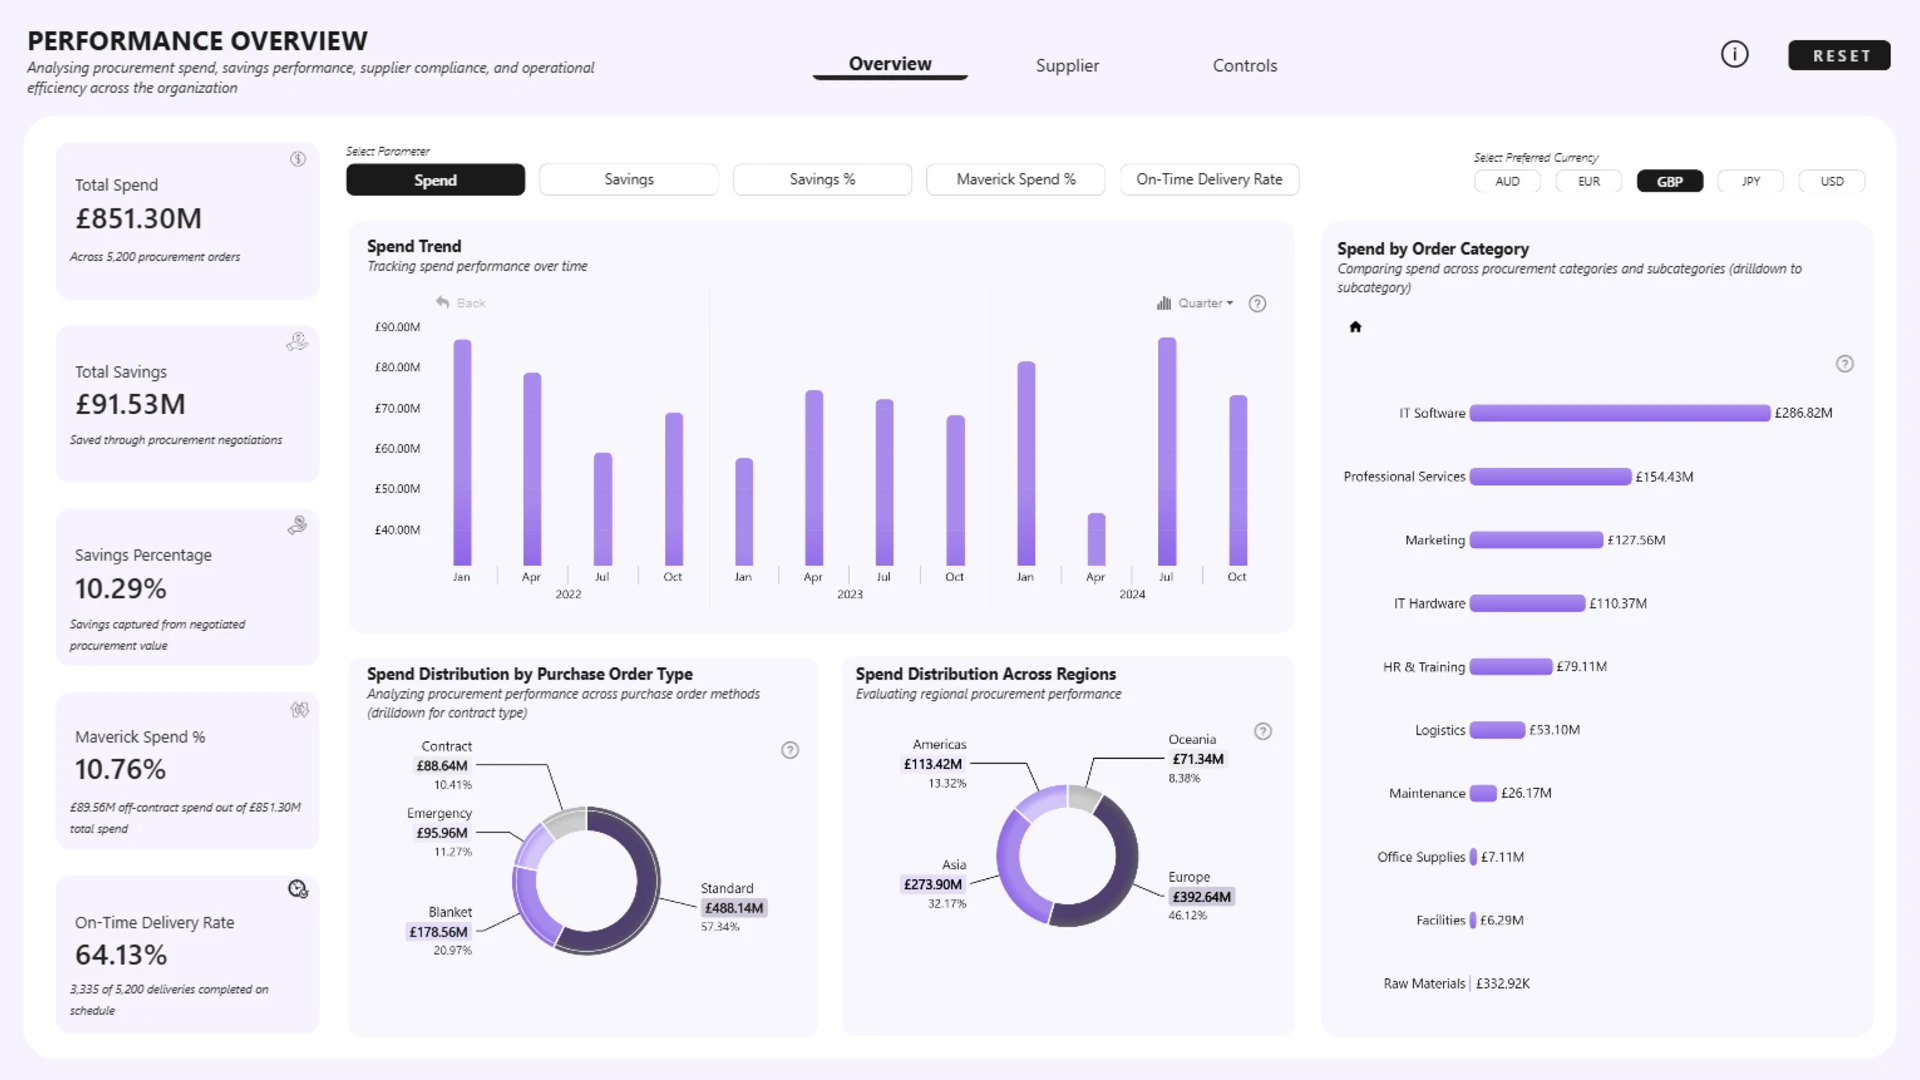
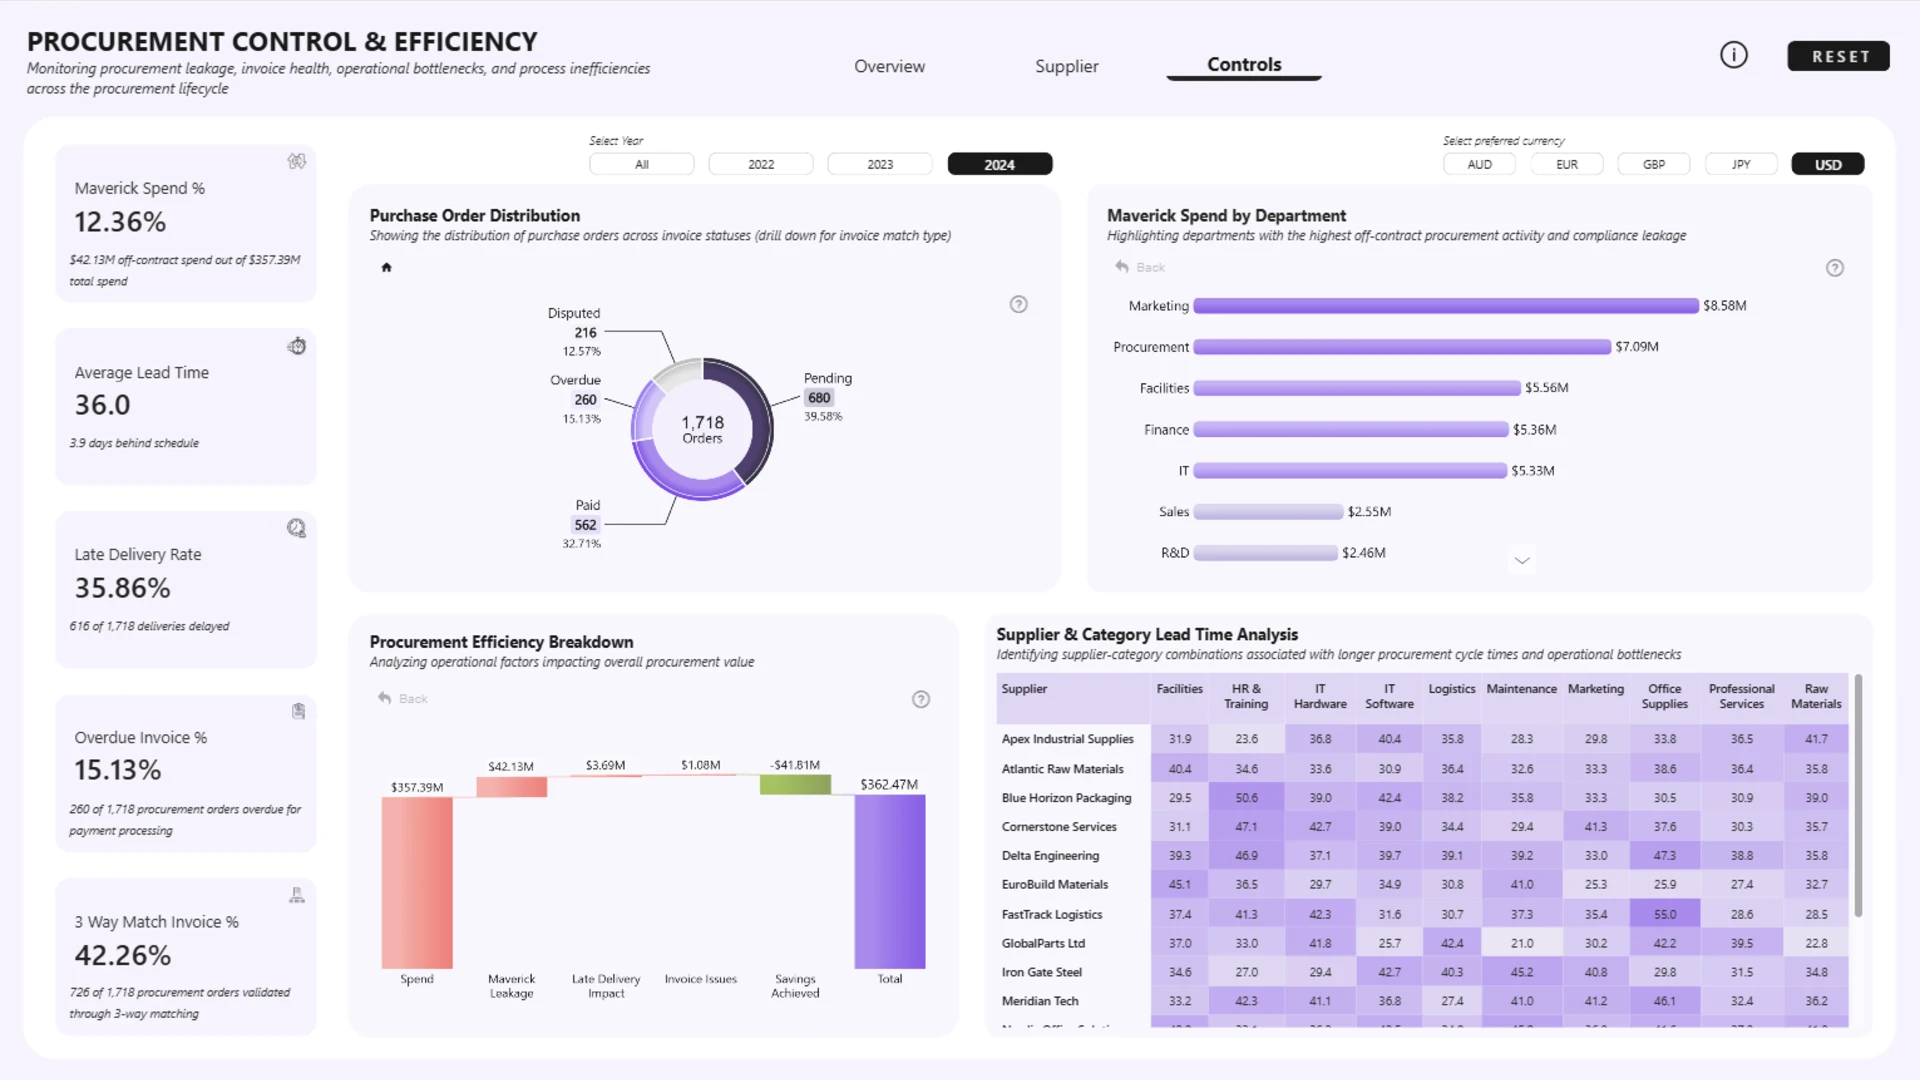
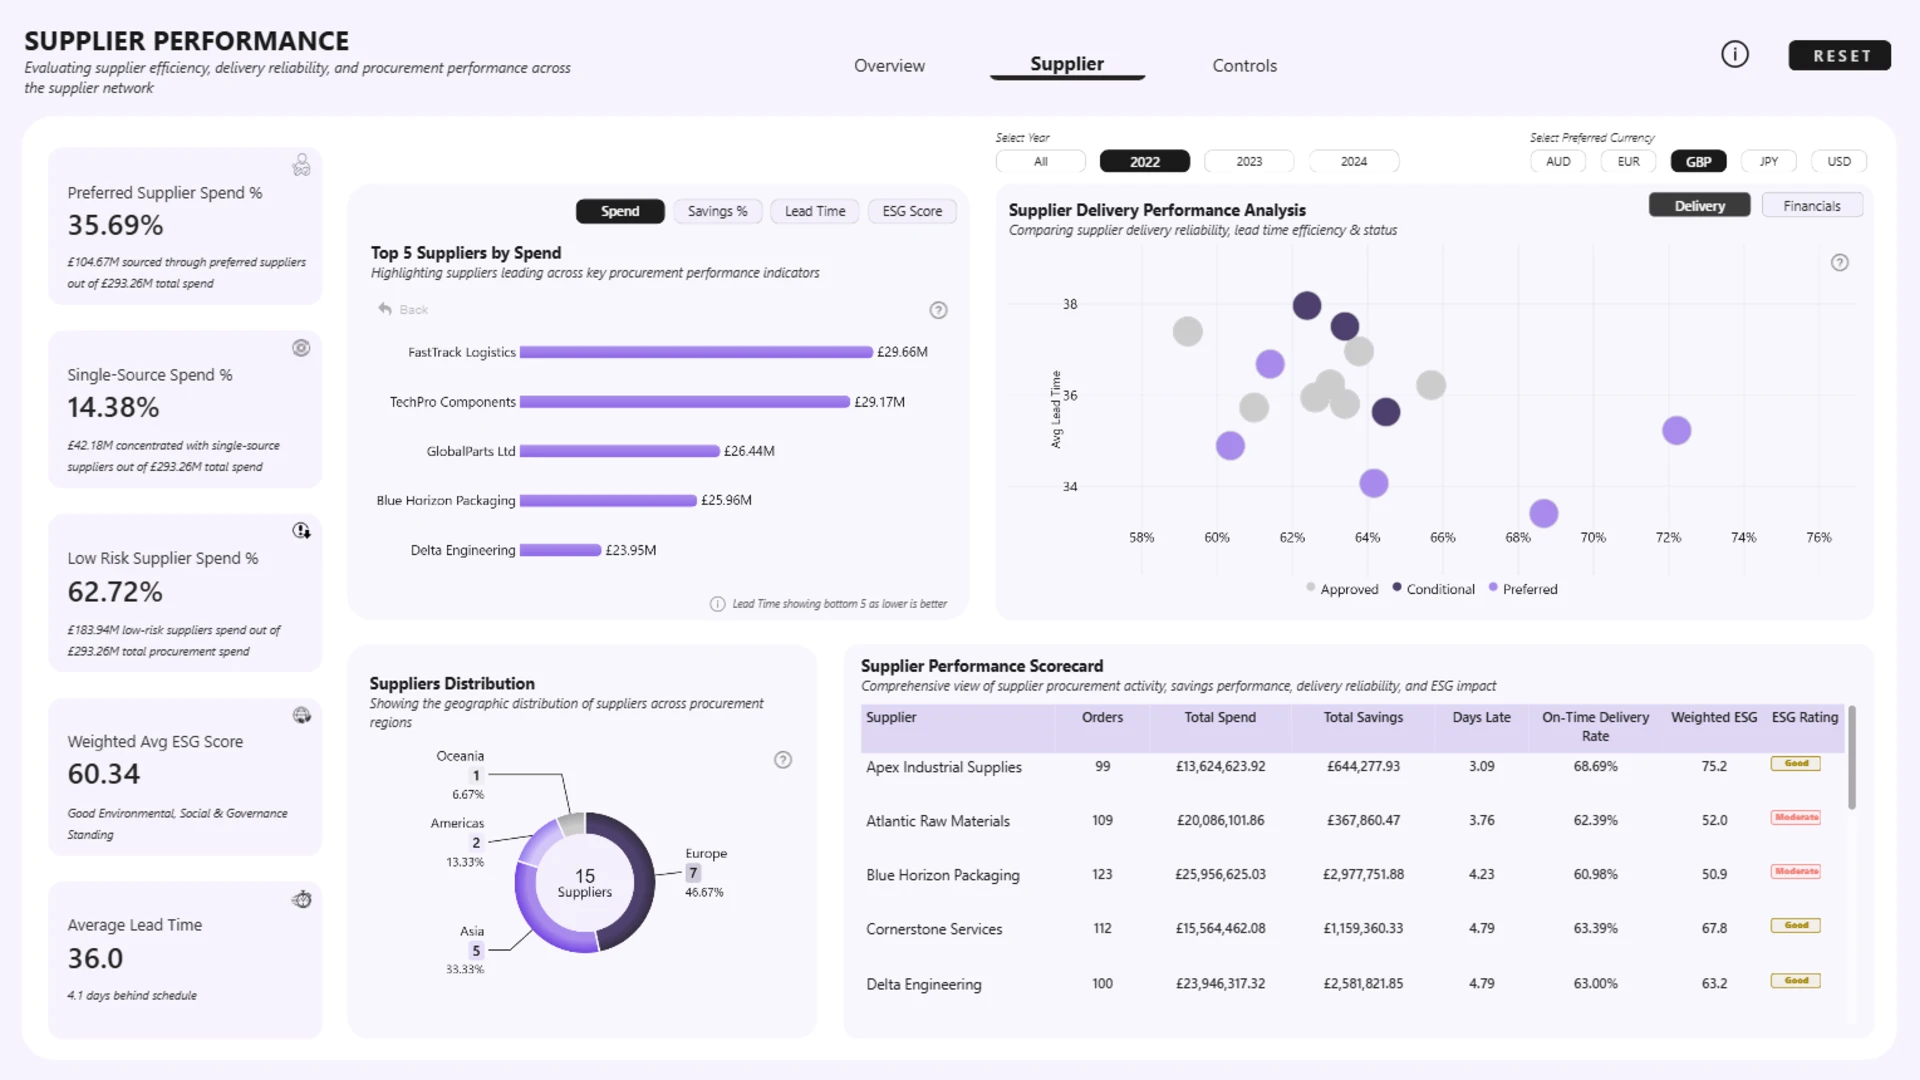
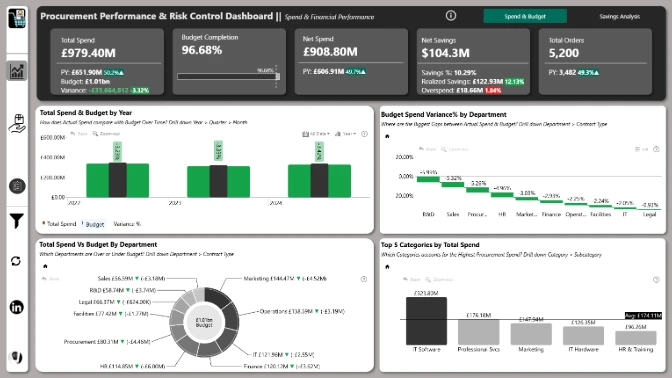
This procurement report analyzes how purchasing activities evolved between 2022 and 2024, with a focus on spend visibility, supplier performance, operational efficiency, and procurement control. The dashboard is divided into three connected pages covering procurement overview analytics, supplier performance and risk, and operational controls such as maverick spend, overdue invoices, delivery delays, and procurement validation processes.
The report helps users identify spending trends, monitor supplier reliability, evaluate procurement efficiency, and uncover governance risks across the procurement lifecycle. Rather than simply presenting numbers, the dashboard is designed to tell a complete procurement story through interactive and data-driven insights. Built in Microsoft Power BI using ZoomCharts Drill Down Visuals, the report supports intuitive multi-level exploration and enhanced user experience.
ZoomCharts visuals used
4U Report Challenges
Participate in data challenges, build and submit reports to get free template downloads.
Join CommunityMobile view allows you to interact with the report. To Download the template please switch to desktop view.
Was this helpful? Thank you for your feedback!
Sorry about that.
How can we improve it?