53144
Power BI Procurement Dashboard Example for Spend Analysis
Power BI Procurement Dashboard Example for Spend Analysis
More Report pages
Report Author: ZoomCharts
53144
Share template with others
Summary
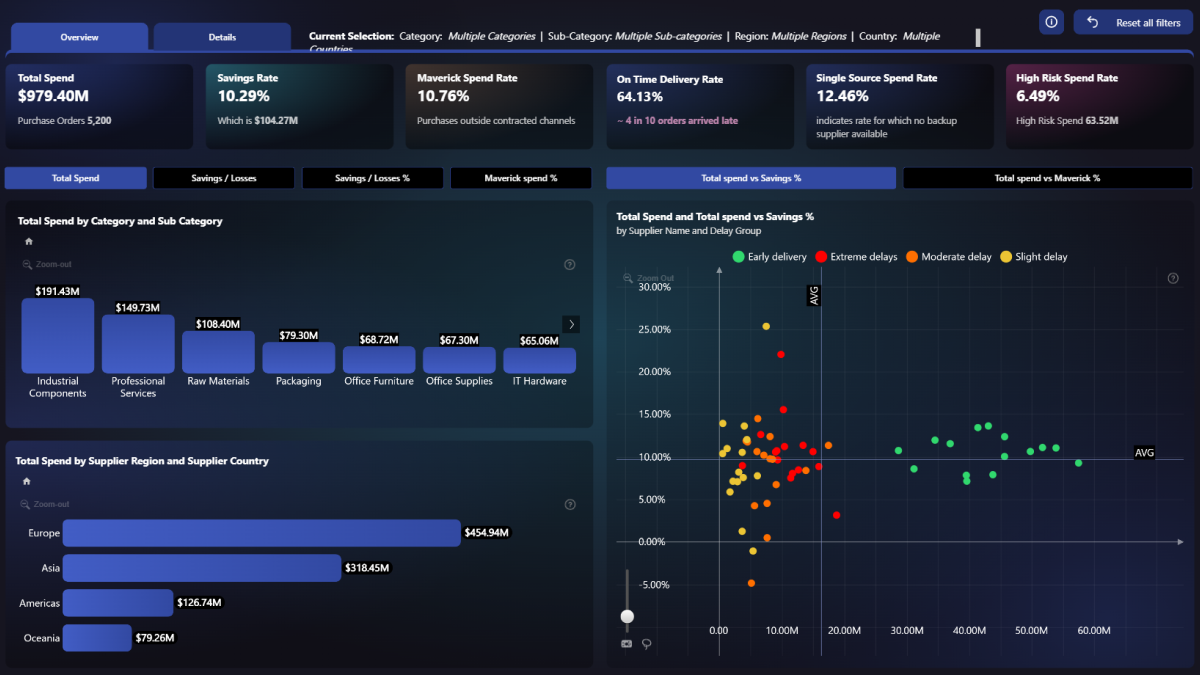
This Power BI procurement dashboard provides a clear view of purchasing activity, supplier performance, savings, and delivery reliability. It helps procurement, finance, and operations teams monitor spending, identify cost-saving opportunities, and improve control over the purchasing process.
Key Insights of the Power BI Procurement Dashboard for Spend Analysis
The report brings together high-level procurement KPIs, trend analysis, supplier comparisons, and transaction details. Key insights include:
- Procurement performance: total spend, savings percentage, and delivery rate
- Spend analysis: purchasing activity by category, supplier, region, and department
- Supplier performance: delivery reliability, savings contribution, risk, and supplier dependency
- Contract compliance: maverick spend and off-contract purchasing activity
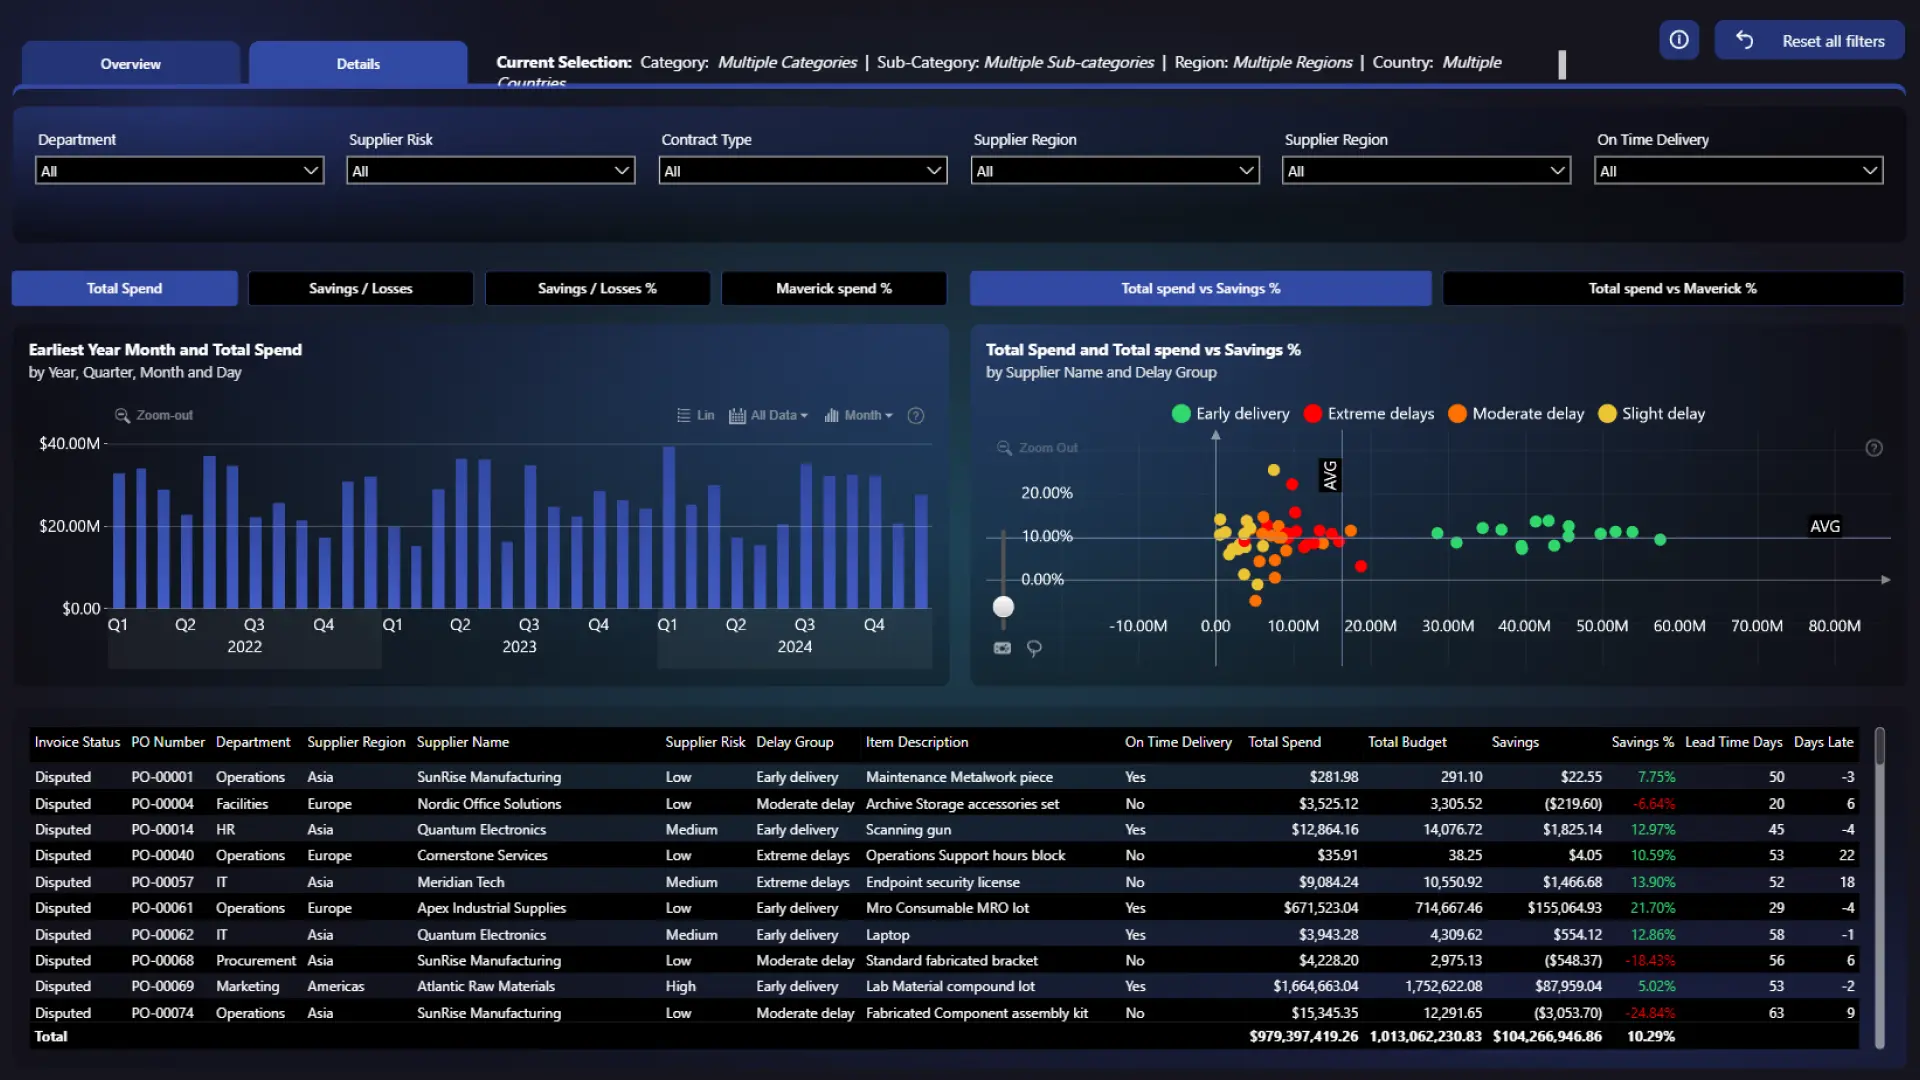
- Procurement trends: changes in spending and purchasing performance over time
- Transaction details: individual purchase orders, invoices, and supplier records
Interactive Power BI visuals make it easy to compare procurement results from different perspectives and move from an overall performance view to more detailed supplier or transaction-level analysis.
How to Use This Power BI Procurement Dashboard
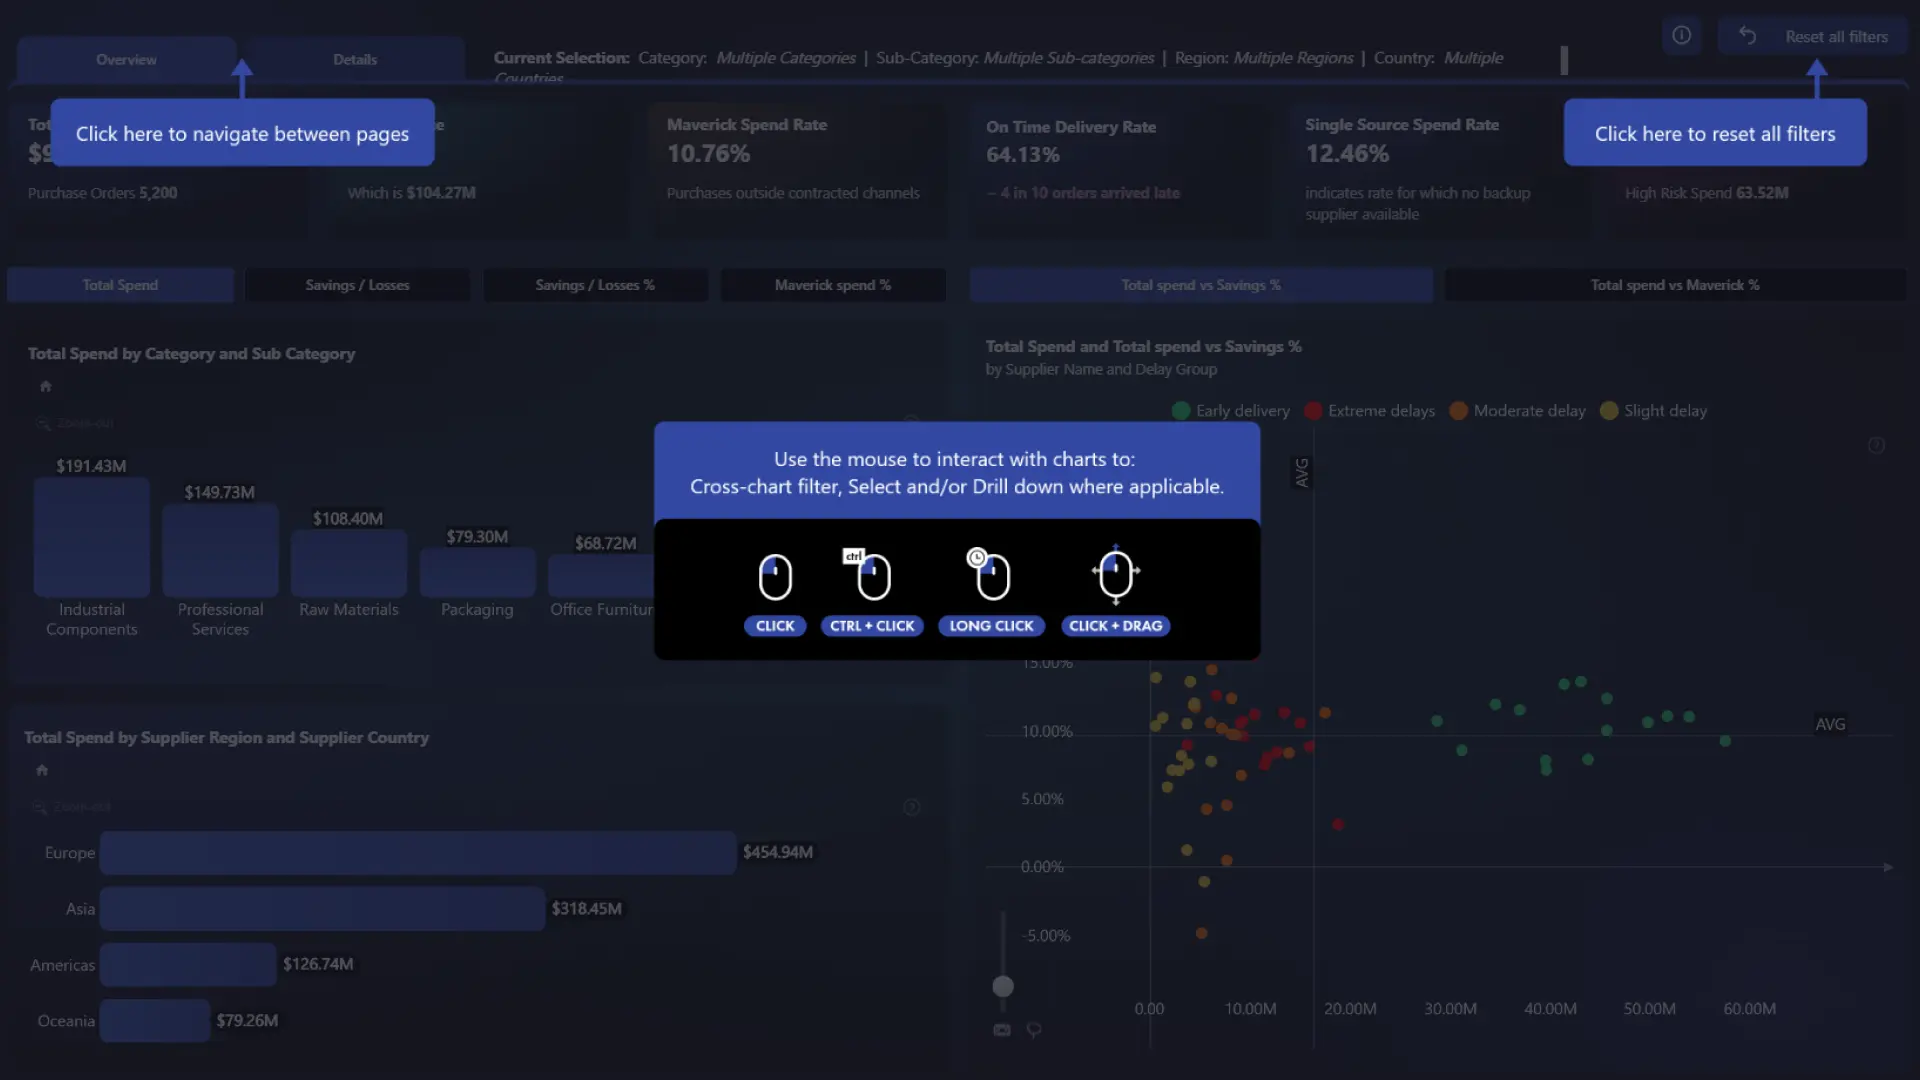
Click active chart elements to filter the report and explore spend by supplier, category, department, region, or reporting period. Use the drill-down functionality to investigate purchasing trends, delivery issues, supplier concentration, and potential compliance risks in greater detail.
Download the .pbix template to review its visuals, measures, calculations, and interactions. You can then connect the report to your own procurement data and adapt the analysis to your organization’s suppliers, purchasing categories, and performance targets.
ZoomCharts visuals used




4U Report Challenges
Participate in data challenges, build and submit reports to get free template downloads.
Join CommunityMobile view allows you to interact with the report. To Download the template please switch to desktop view.
How to use a PBIX template
Preview the interactive report, download the PBIX file, open it in Power BI Desktop, and replace the same data connection with your own dataset.
Preview and download
Explore the report online and download the PBIX template file.
Open in Power BI Desktop
Open the downloaded PBIX file in Power BI Desktop.
Connect your data
Replace the sample data source with your own dataset.
Refresh and adjust
Refresh the model and update fields or visual were needed.
Save and share
Save your report and publish it for your audience.


