435
Power BI Legal Dashboard Design Example
Power BI Legal Dashboard Design Example
More Report pages
Report Author: Aman Sharma
435
Share template with others
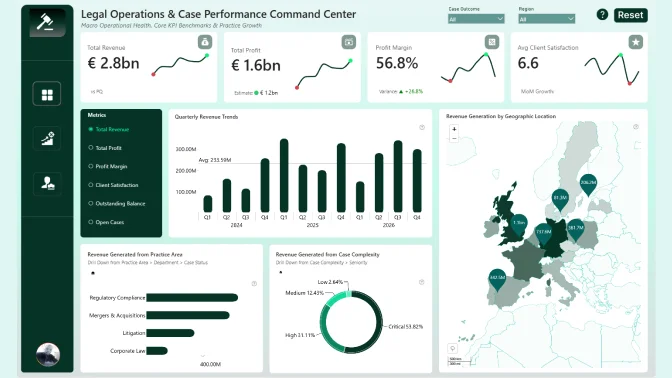
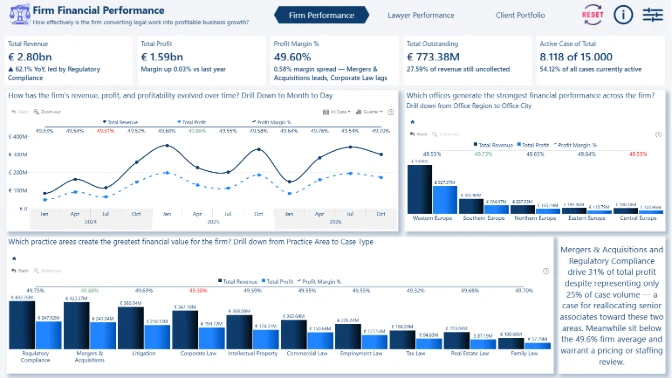
View a Power BI legal dashboard design example that organizes firm KPIs, case results, profitability, workload, client value, risk, and satisfaction.
Author’s Description:
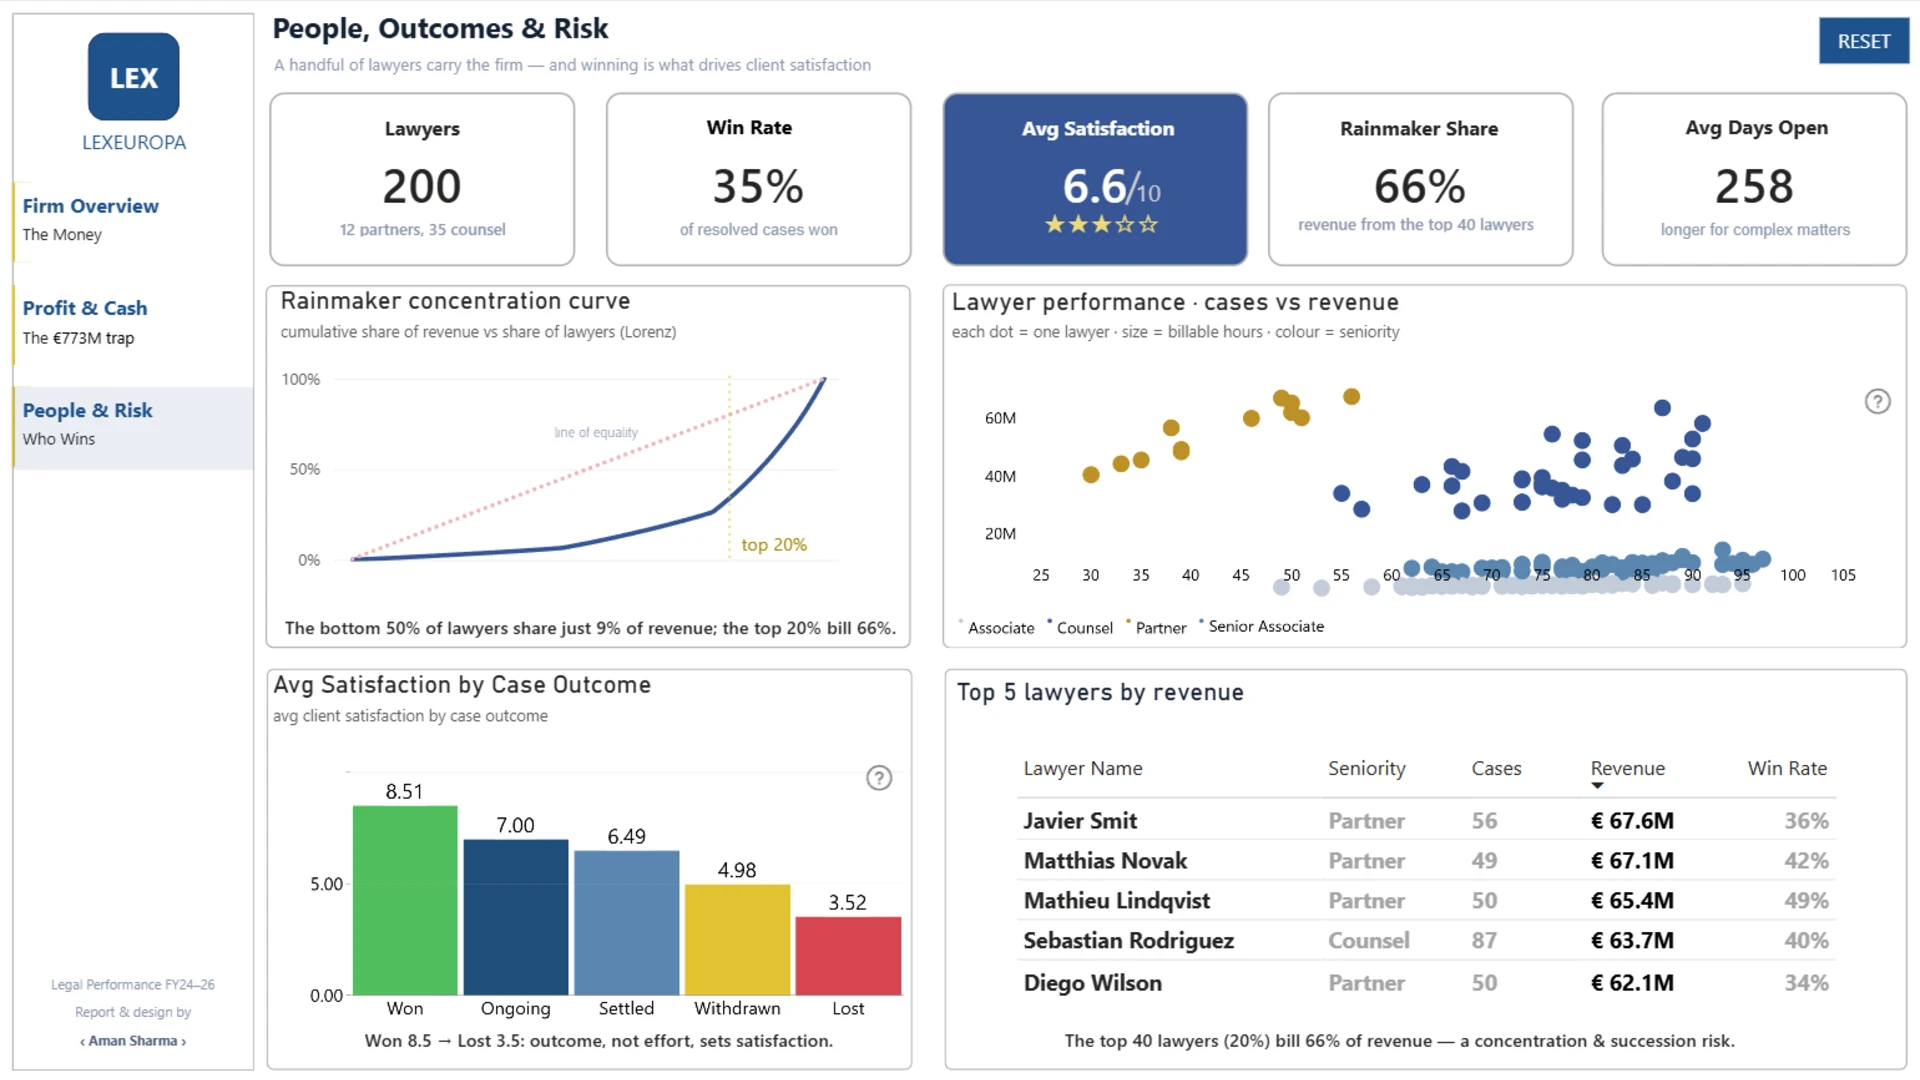
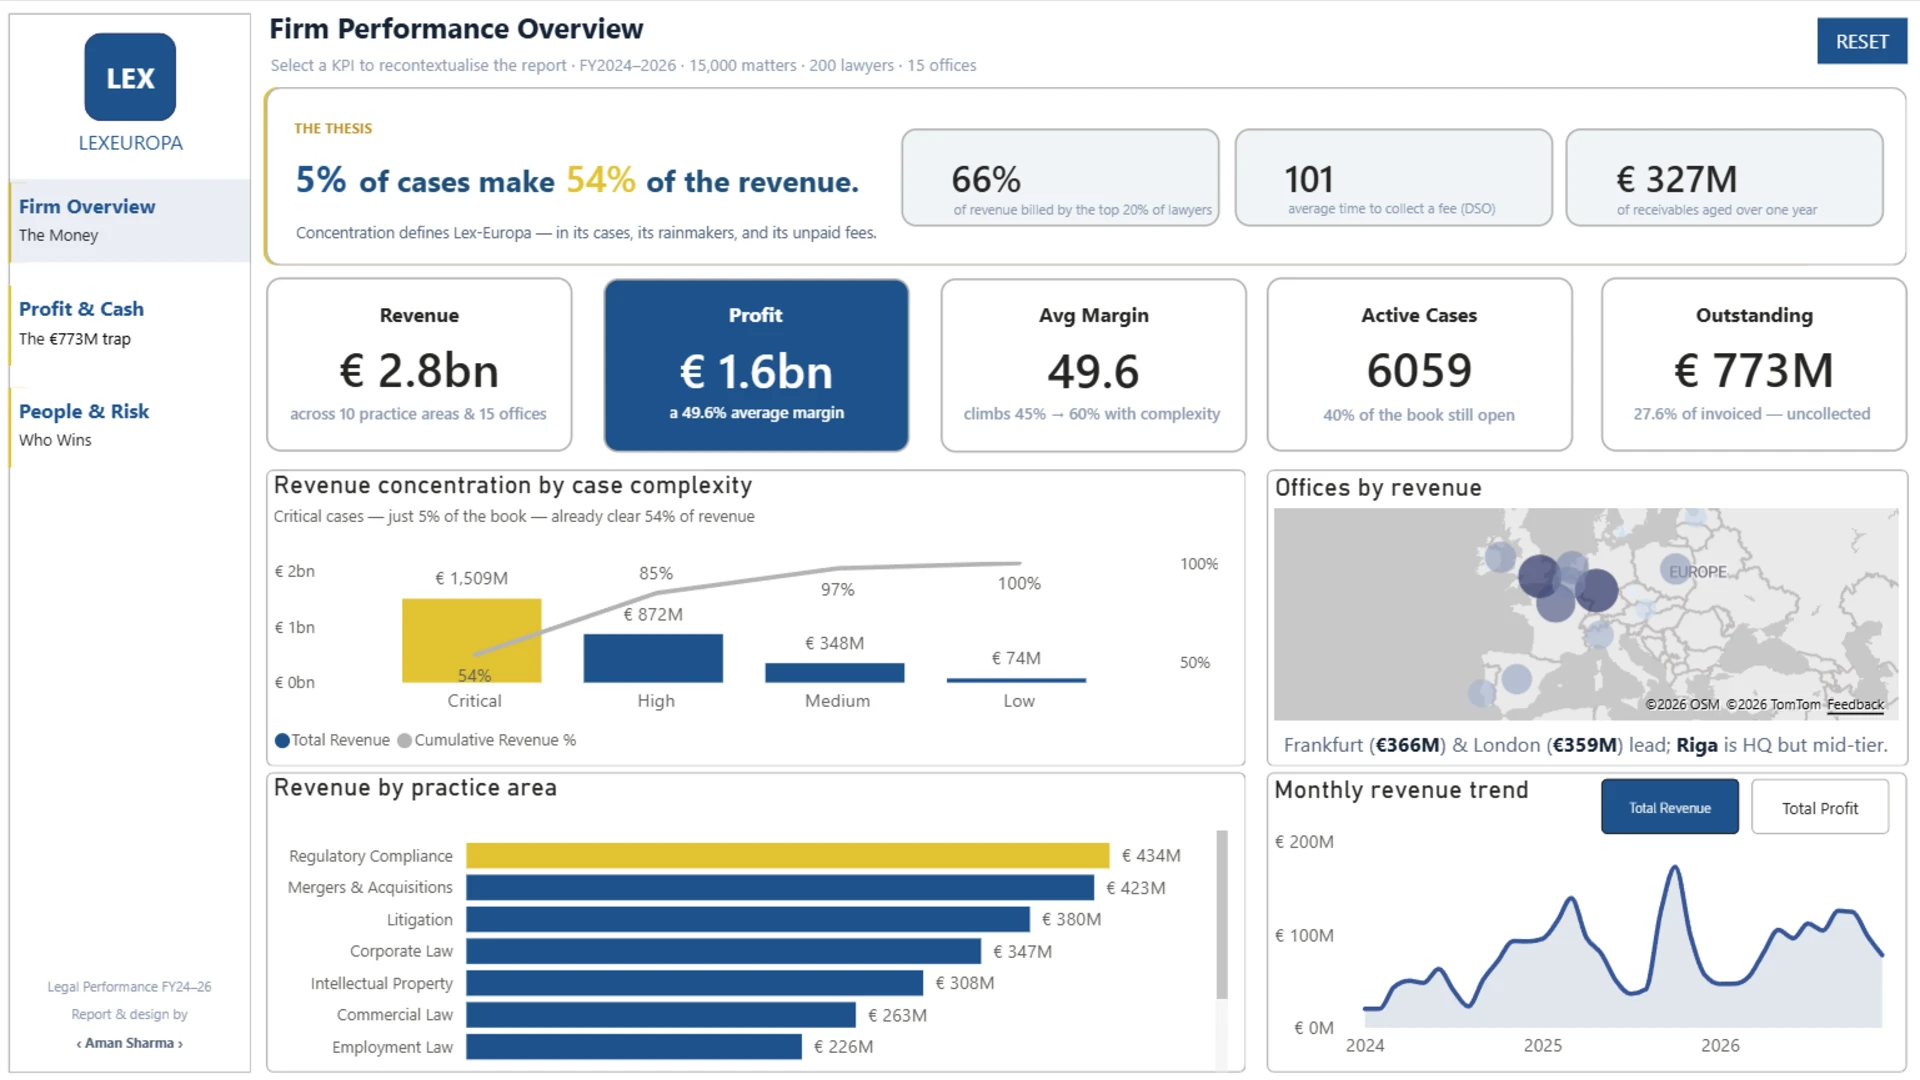
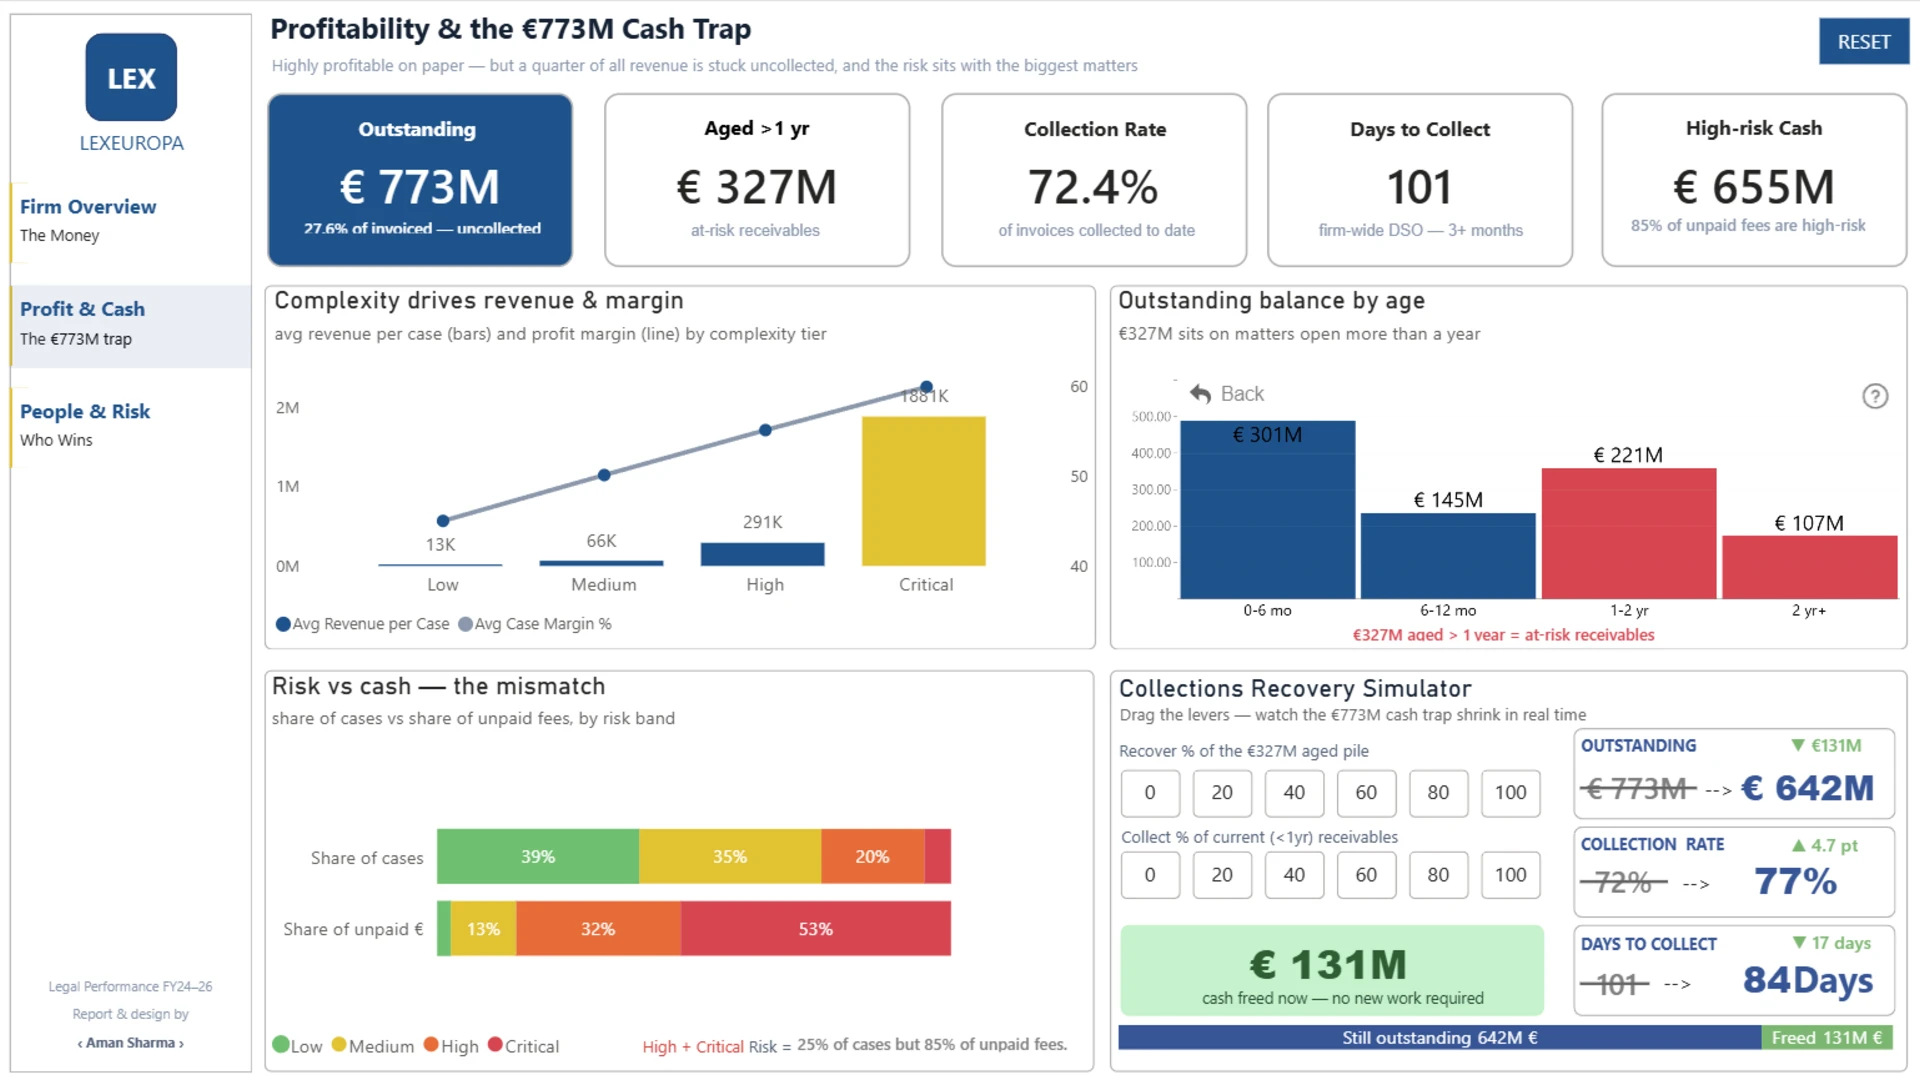
An interactive 3-page Power BI report for LexEuropa, a pan-European law firm. Built around the insight that the firm's performance is driven by concentration: 5% of cases generate 54% of revenue, the top 20% of lawyers produce 66% of billings, and €773M remains uncollected, with 85% classified as high-risk. The report features ZoomCharts Drill Down visuals, hierarchical navigation, a KPI selector, a two-lever cash recovery simulator, and AI-style dynamic insights that update instantly with every filter.


4U Report Challenges
Participate in data challenges, build and submit reports to get free template downloads.
Join CommunityMobile view allows you to interact with the report. To Download the template please switch to desktop view.
How to use a PBIX template
Preview the interactive report, download the PBIX file, open it in Power BI Desktop, and replace the same data connection with your own dataset.
Preview and download
Explore the report online and download the PBIX template file.
Open in Power BI Desktop
Open the downloaded PBIX file in Power BI Desktop.
Connect your data
Replace the sample data source with your own dataset.
Refresh and adjust
Refresh the model and update fields or visual were needed.
Save and share
Save your report and publish it for your audience.


