1595
Power BI Employee Performance and Project Planning Dashboard
Power BI Employee Performance and Project Planning Dashboard

More Report pages
Report Author: Crystal Andrea Dsouza
1595
Share template with others
This Power BI report uses the Fintech Project Management dataset and combines ZoomCharts Drill Down PRO custom visuals for Power BI with native Power BI visuals. It was submitted to the FP20 Analytics ZoomCharts Data Challenge 32 in November 2025.
The dashboard helps users explore how employee performance, project planning, task progress, and resource usage are connected. It brings together key workforce and project metrics, including planned hours, actual hours, employee efficiency, hourly rates, labor costs, task status, project status, risk level, and completion %.
It is designed for project managers, PMO teams, HR teams, operations leaders, and analysts who want a friendly, visual way to understand how teams and projects are performing.
You can use this dashboard to quickly answer questions like:
- Which employees or departments have the highest efficiency?
- How do planned hours compare with actual hours?
- Which projects and tasks are completed or still in progress?
- Where are labor costs highest?
- How does employee efficiency vary by experience level?
- How are employees distributed across countries and cities?
- Which tasks have high priority or high risk?
Key insights of this report
This Power BI employee performance report helps users explore important workforce, project, and task metrics, including:
- Total employees
- Average actual hours
- Employee efficiency
- Average hourly rate
- Employee planned hours
- Employee actual hours
- Hourly rate
- Labor cost
- Employee efficiency by experience level
- Total employees by country and city
- Department-level performance
- Project and task status
- Task priority
- Planned start and end dates
- Task duration
- Planned hours
- Risk level
- Completion %
These metrics make it easier to understand how employee workload, project planning, task progress, and labor costs affect overall performance.
What you can explore in the report
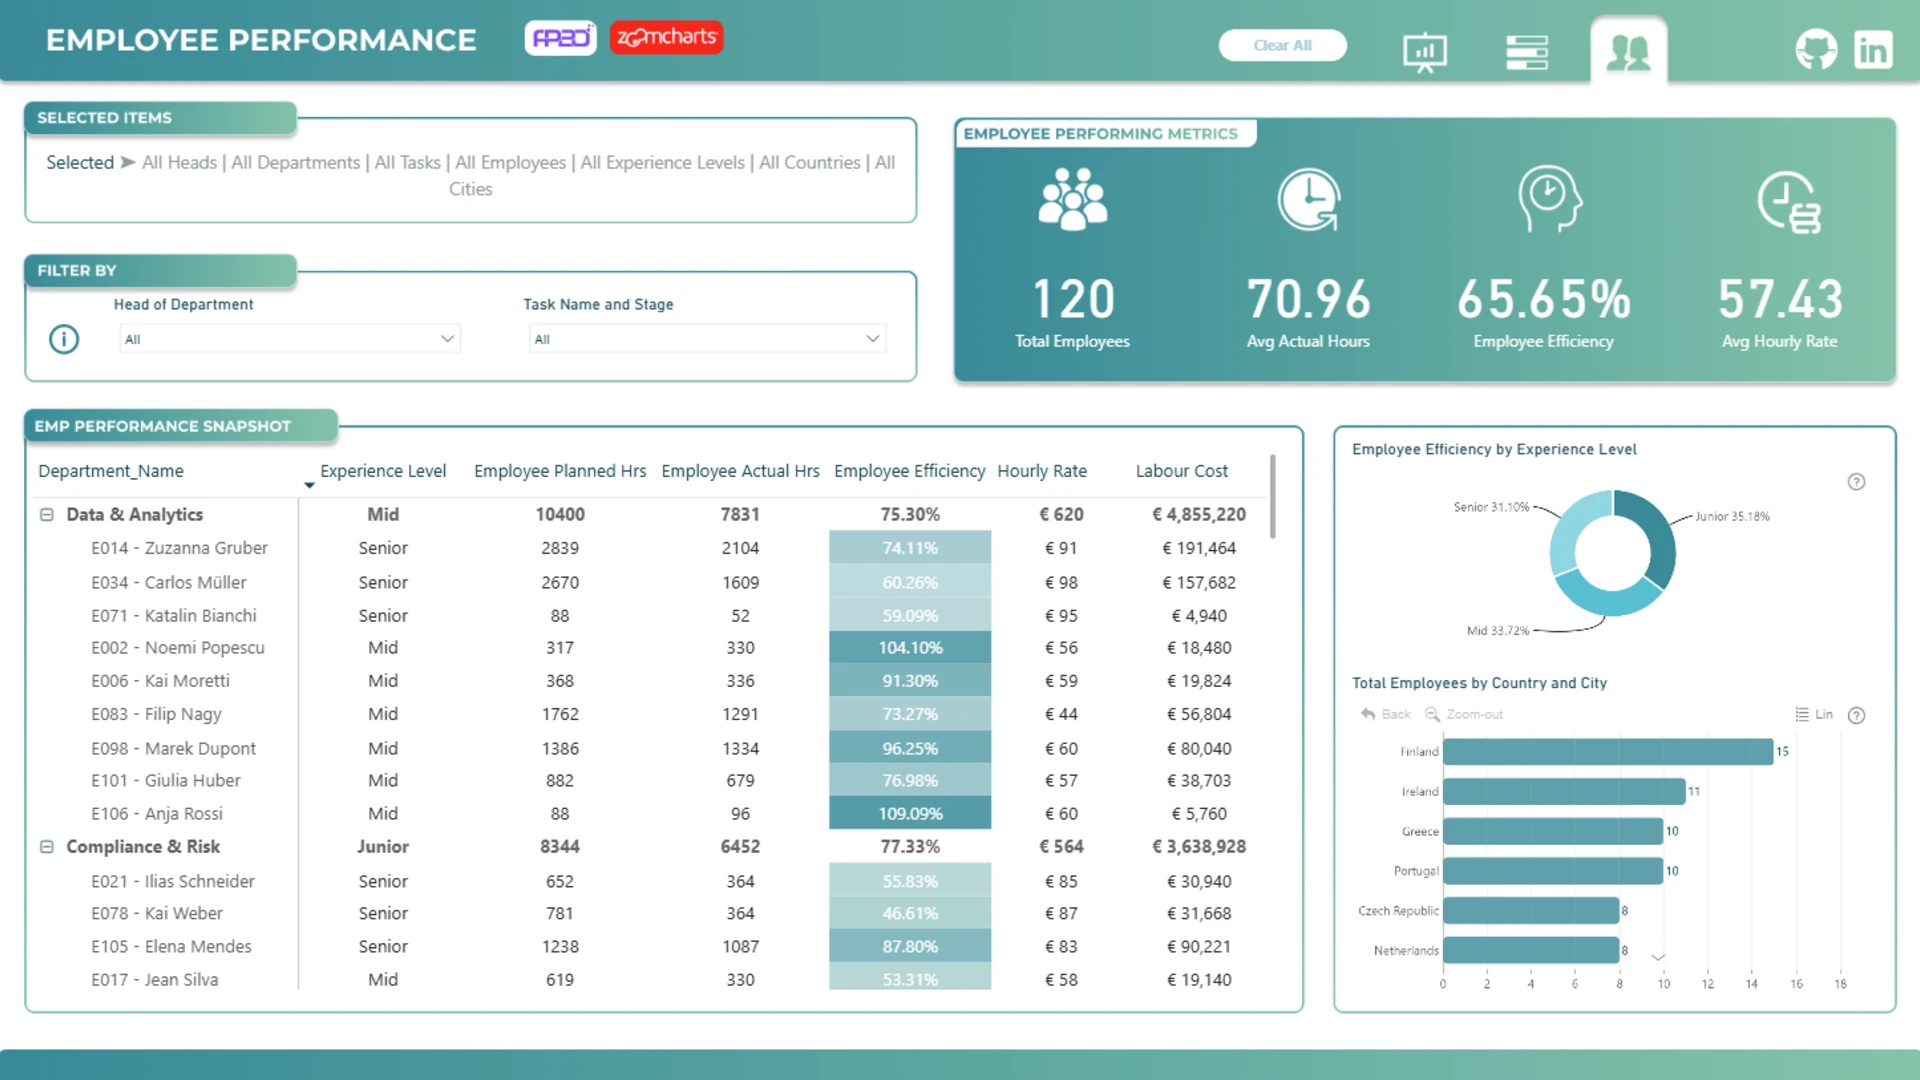
Employee performance
The employee performance page gives a people-focused view of performance across departments and employees.
It includes high-level KPIs for:
- Total employees
- Average actual hours
- Employee efficiency
- Average hourly rate
The detailed employee performance table lets users review:
- Department name
- Employee name
- Experience level
- Employee planned hours
- Employee actual hours
- Employee efficiency
- Hourly rate
- Labor cost
Additional charts show employee efficiency by experience level and total employees by country and city, making it easier to compare workforce performance and employee distribution across locations.
This page is useful when you want to understand workload, compare performance by experience level, or see where labor costs and hours are concentrated.
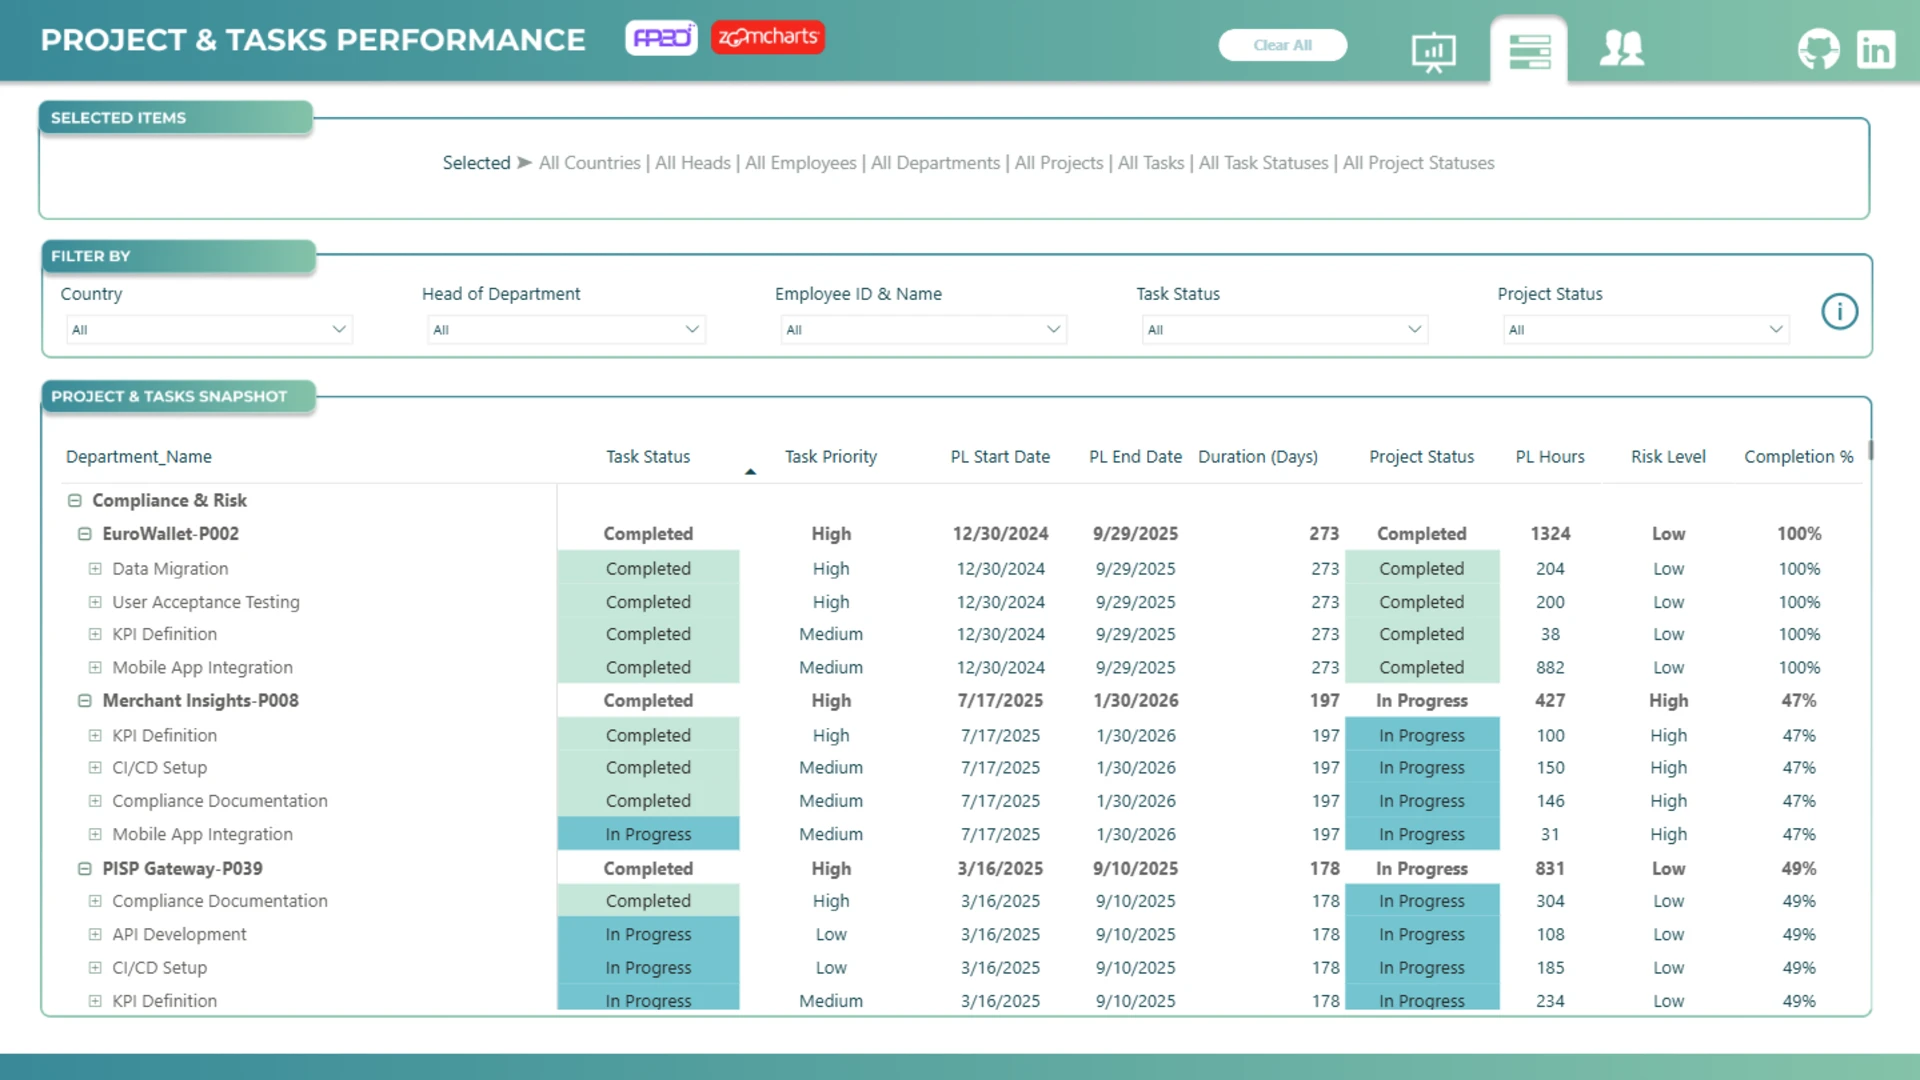
Project and tasks performance
The project and tasks performance page gives a detailed view of project planning and task execution.
It includes project and task details such as:
- Department name
- Project name
- Task status
- Task priority
- Planned start date
- Planned end date
- Duration in days
- Project status
- Planned hours
- Risk level
- Completion %
This page is useful for tracking project progress, reviewing completed and in-progress tasks, and identifying high-priority or high-risk work.
With the detailed task table, users can drill into projects and see how individual tasks contribute to overall project performance.
Interactive report features
Users can interact with the report to explore the data in more detail.
The report allows users to:
- Filter by country, head of department, employee, department, task status, and project status
- Track selected items at the top of the report
- Clear all filters with one click
- Switch between report pages using the navigation icons
- Review employee, task, and project data in one report
- Move from high-level KPIs to detailed task-level information
This makes it easier to find patterns, spot performance gaps, and focus on the areas that need attention.
How to use this report template
To use this Power BI employee performance dashboard, select the filters, table rows, departments, employees, projects, or tasks you want to analyze. Your selections help narrow the report and focus on the details that matter most.
You can use this report template to:
- Monitor employee performance
- Compare planned vs. actual working hours
- Analyze employee efficiency
- Review labor costs
- Track project and task progress
- Identify high-risk tasks
- Review task completion
- Compare performance across departments
- Understand workforce distribution by location
- Improve project planning and resource management
Download the report to explore the full setup, including calculations, interactions, page structure, and dashboard design. You can adapt it to your own employee performance, project planning, workforce analytics, HR analytics, PMO, or operations data.
4U Report Challenges
Participate in data challenges, build and submit reports to get free template downloads.
Join CommunityMobile view allows you to interact with the report. To Download the template please switch to desktop view.

Was this helpful? Thank you for your feedback!
Sorry about that.
How can we improve it?