188
Power BI E-commerce Marketing Profitability Dashboard
Power BI E-commerce Marketing Profitability Dashboard
More Report pages
Report Author: Lucky Justice Nelson
188
Share template with others
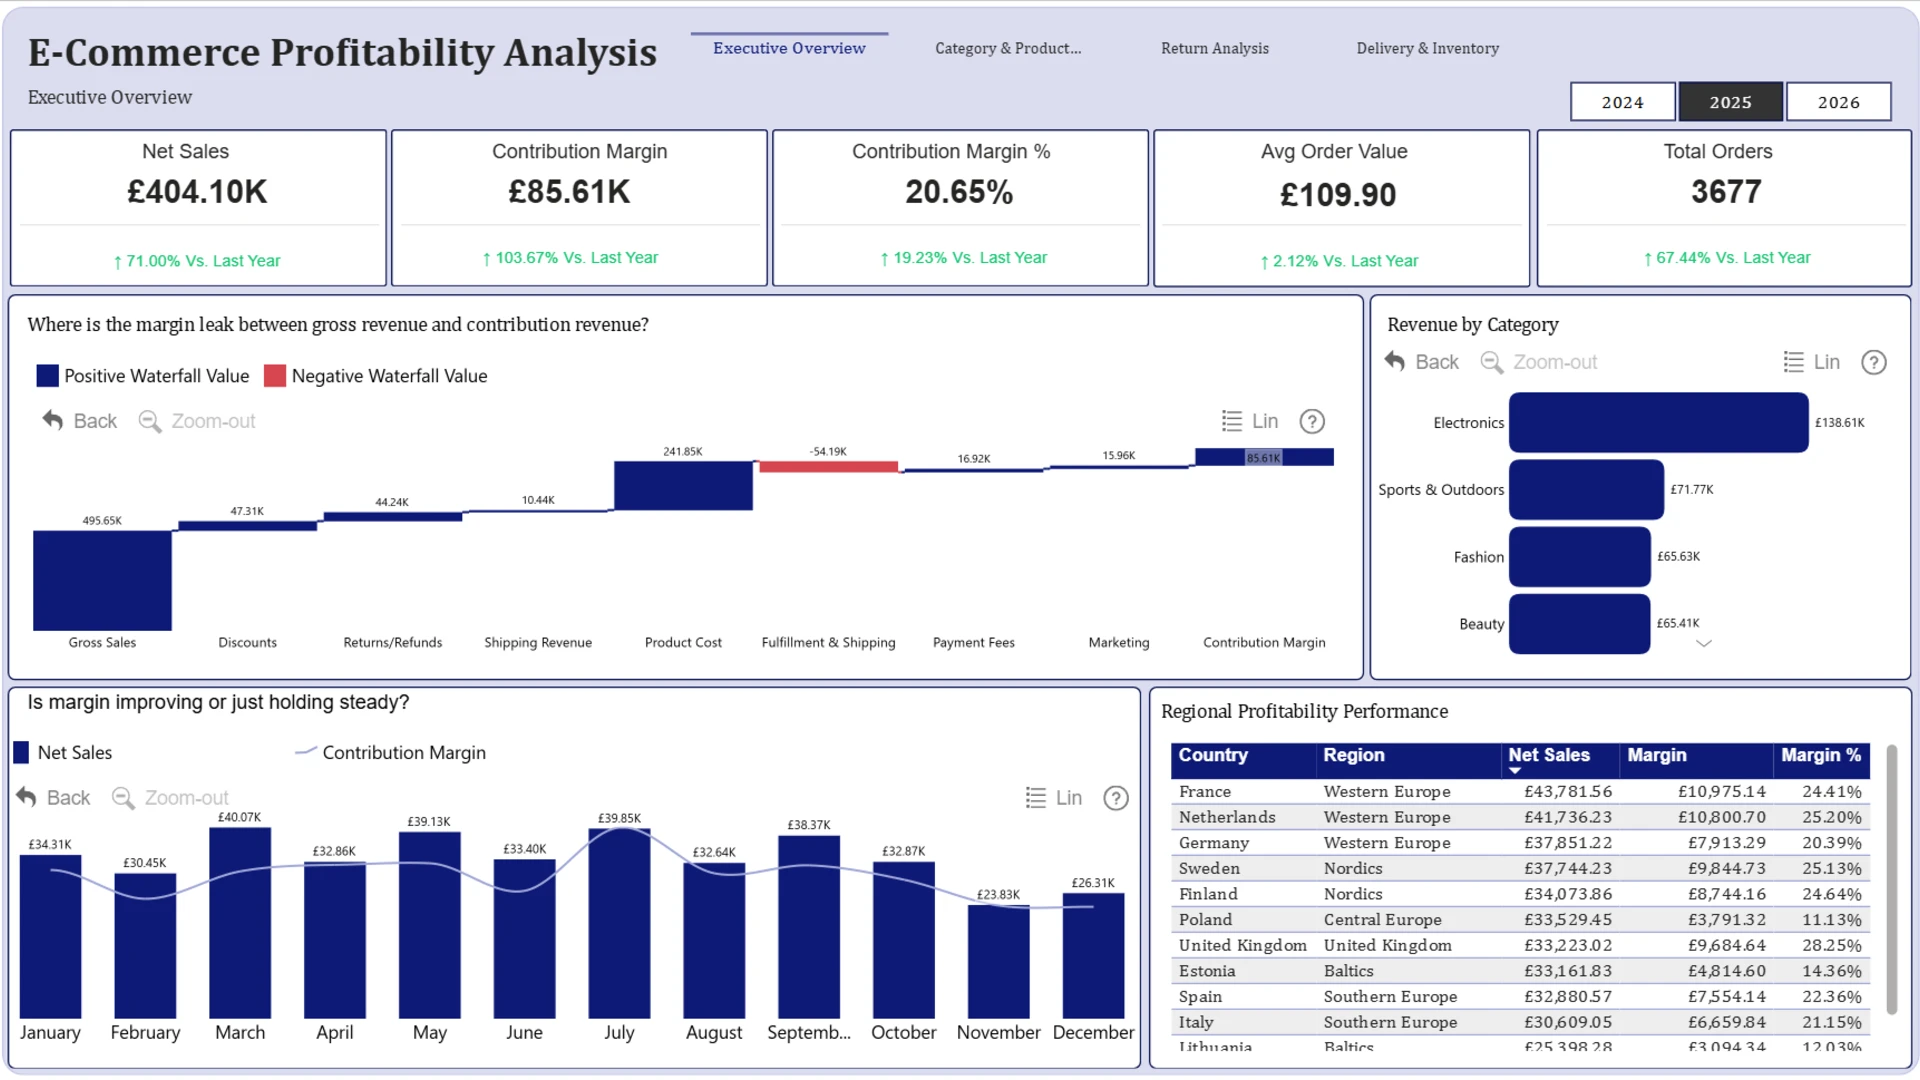
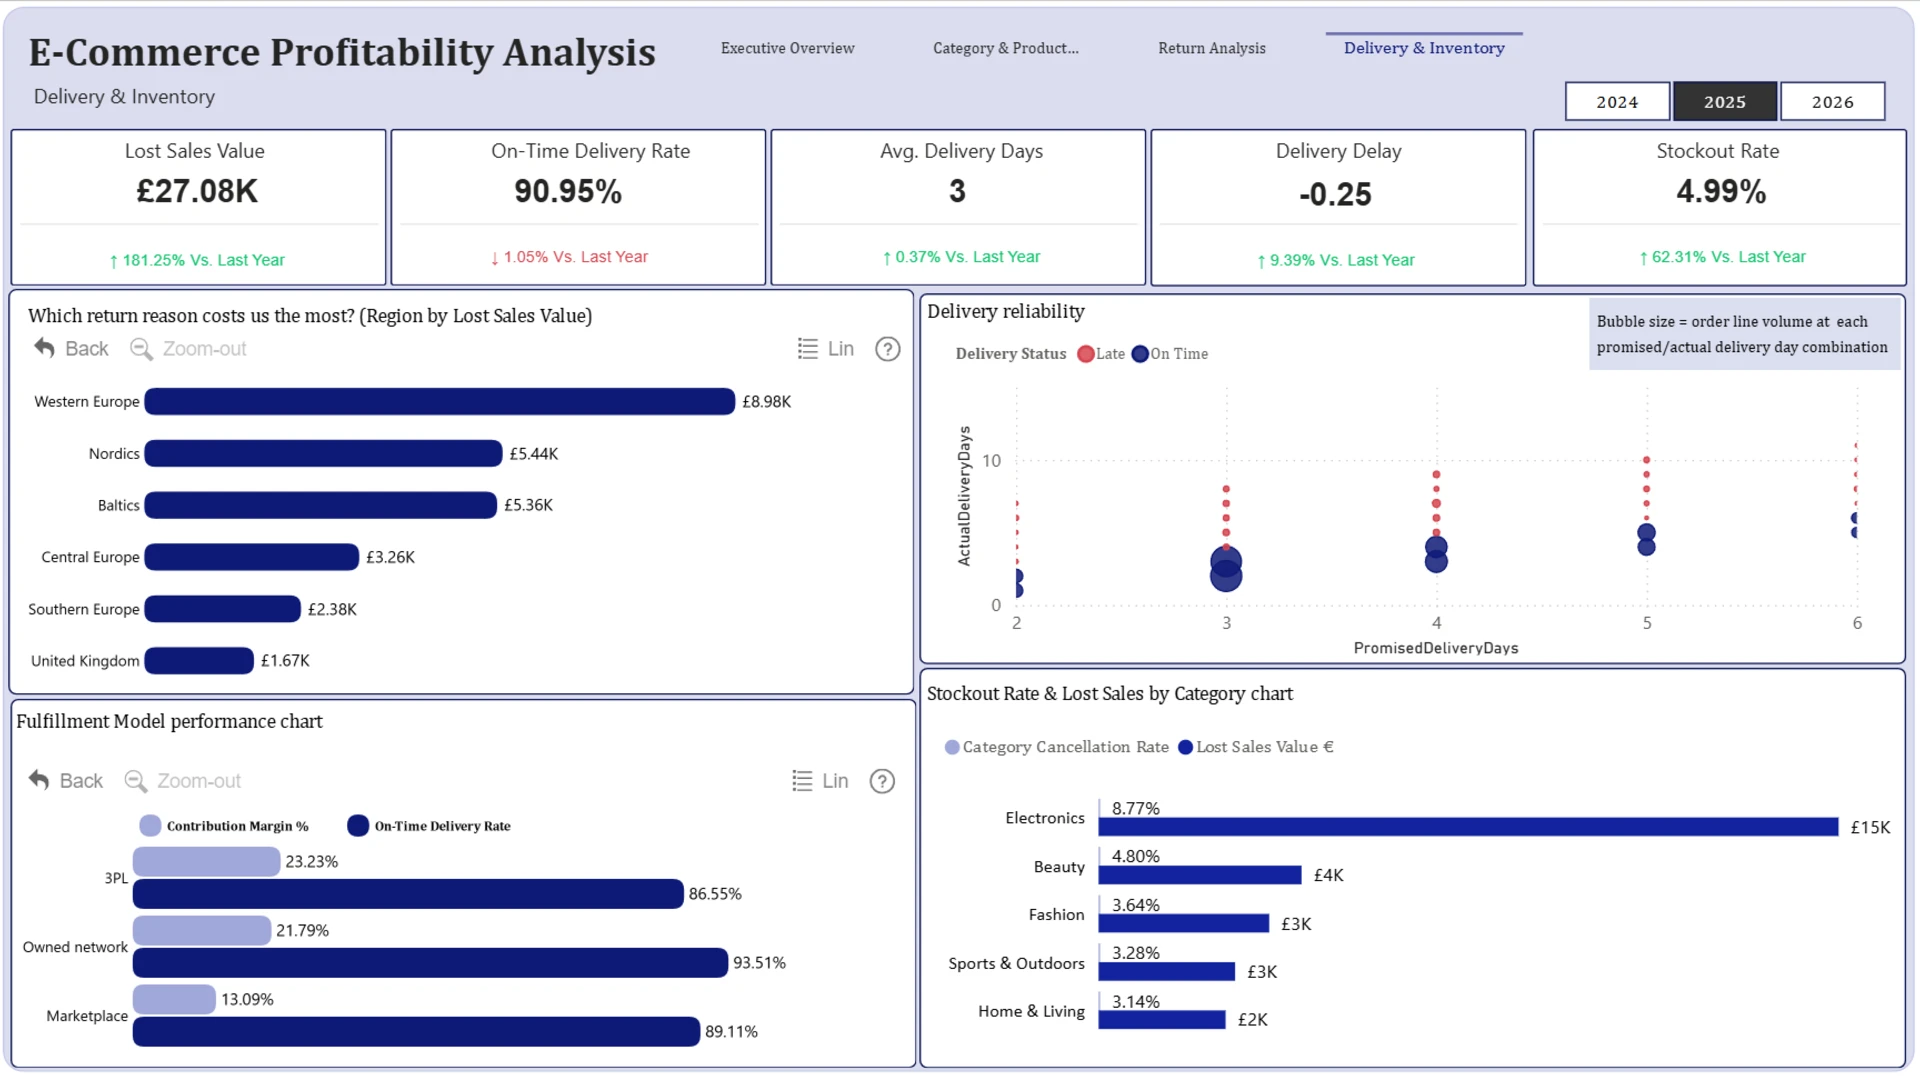
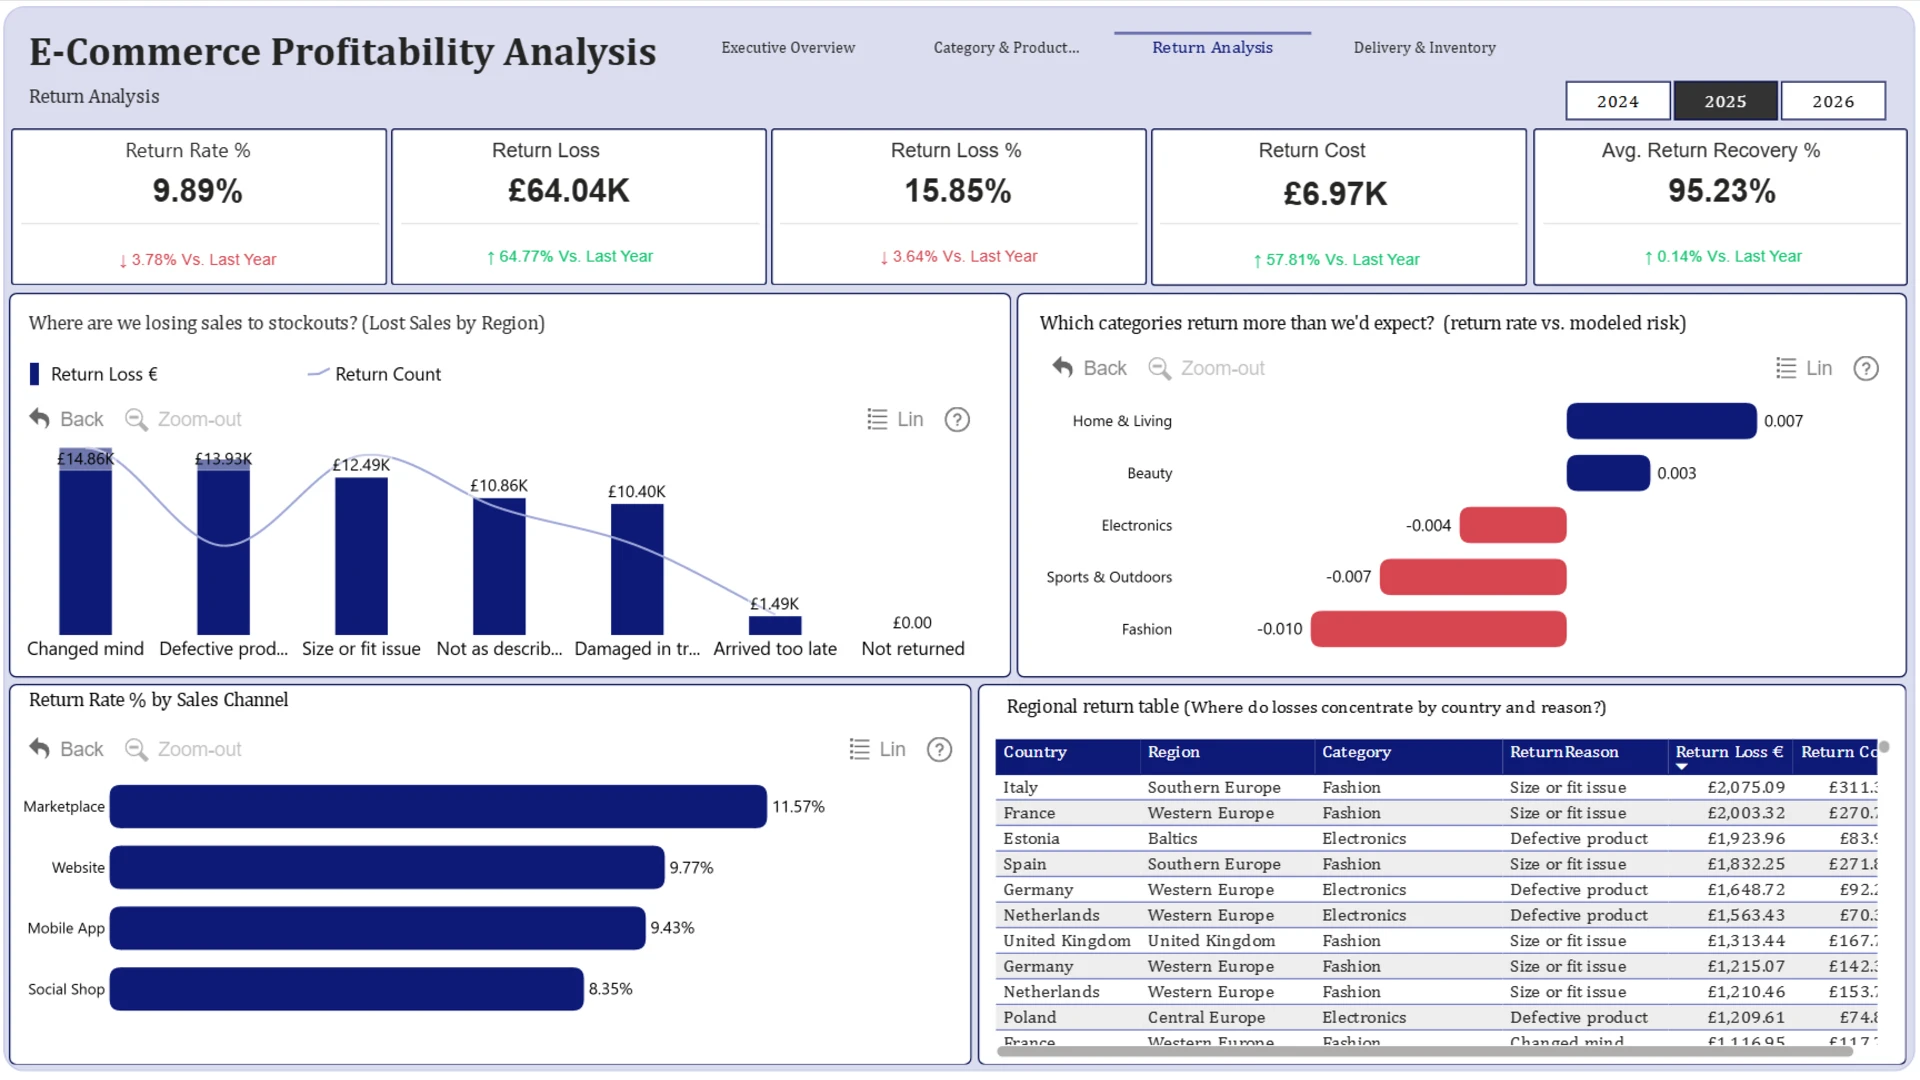
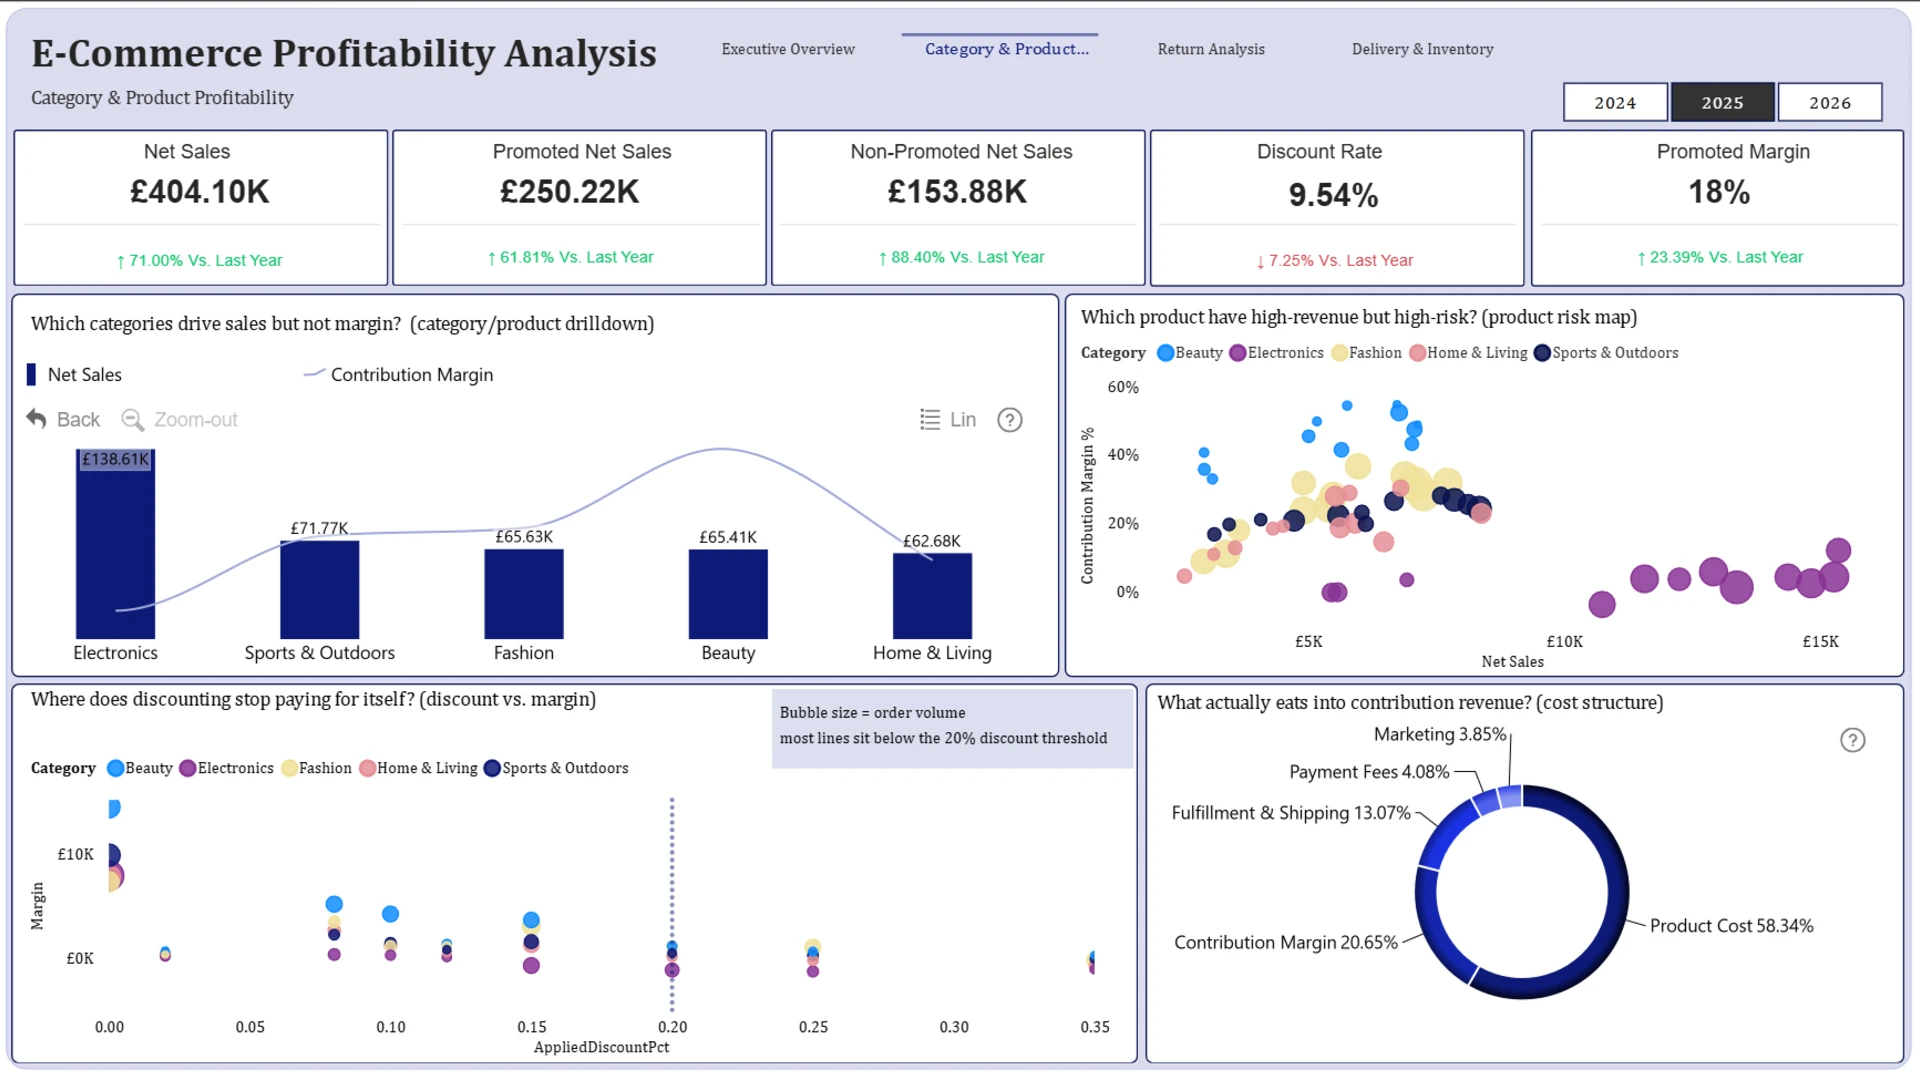
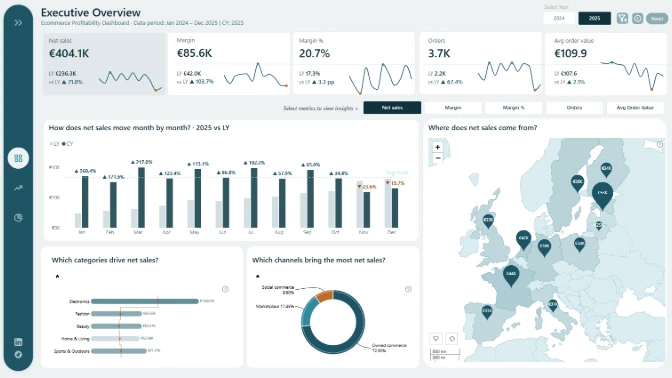
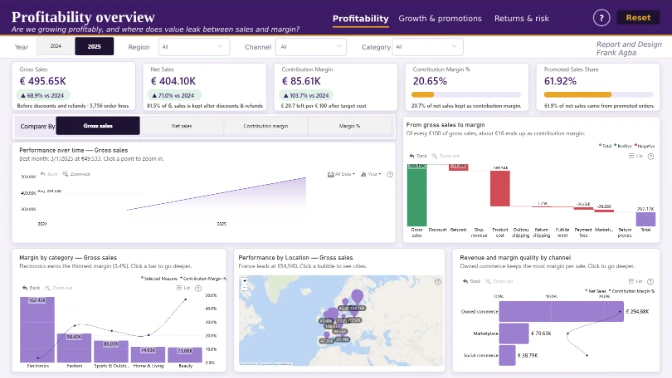
This four-page Power BI report looks beyond sales performance to show where profitability is gained or lost across the e-commerce business. The analysis covers Executive Overview, Category & Product Profitability, Return Analysis, and Delivery & Inventory.
Executive Overview
The report starts with a clear view of revenue, costs, and contribution margin, including a margin bridge that traces the movement from gross sales to final contribution margin.
Category & Product Profitability
Electronics generates the highest sales at £138.6K, but contributes very little margin. Beauty, by comparison, sells less than half as much while delivering more than 15 times the profitability.
The report also shows how discounting affects margin. Profitability remains relatively stable up to around a 20% discount, but drops sharply beyond that point. A significant share of heavily discounted order lines are sold at or below cost.
Return Analysis
Returns are separated by their underlying causes rather than treated as a single issue. “Changed mind” accounts for the largest number of returns, pointing to a demand or expectation problem. “Defective product” generates almost as much financial loss from far fewer returned orders, highlighting a different issue related to product quality.
Delivery & Inventory
Marketplace sales stand out as an area requiring attention. This channel records the lowest margin, the weakest on-time delivery performance, and the highest return rate, making the issue visible across several different measures.
The report also includes a detailed margin waterfall and cost breakdown, with all calculations reconciled back to the source data.
ZoomCharts visuals used include Drill Down Waterfall PRO, Drill Down Combo PRO, Drill Down Combo Bar PRO, and Drill Down Bubble PRO.
ZoomCharts visuals used




4U Report Challenges
Participate in data challenges, build and submit reports to get free template downloads.
Join CommunityMobile view allows you to interact with the report. To Download the template please switch to desktop view.
How to use a PBIX template
Preview the interactive report, download the PBIX file, open it in Power BI Desktop, and replace the same data connection with your own dataset.
Preview and download
Explore the report online and download the PBIX template file.
Open in Power BI Desktop
Open the downloaded PBIX file in Power BI Desktop.
Connect your data
Replace the sample data source with your own dataset.
Refresh and adjust
Refresh the model and update fields or visual were needed.
Save and share
Save your report and publish it for your audience.


