206
Power BI E-commerce Financial Performance Report
Power BI E-commerce Financial Performance Report
More Report pages
Report Author: Koustav Ghosh
206
Share template with others
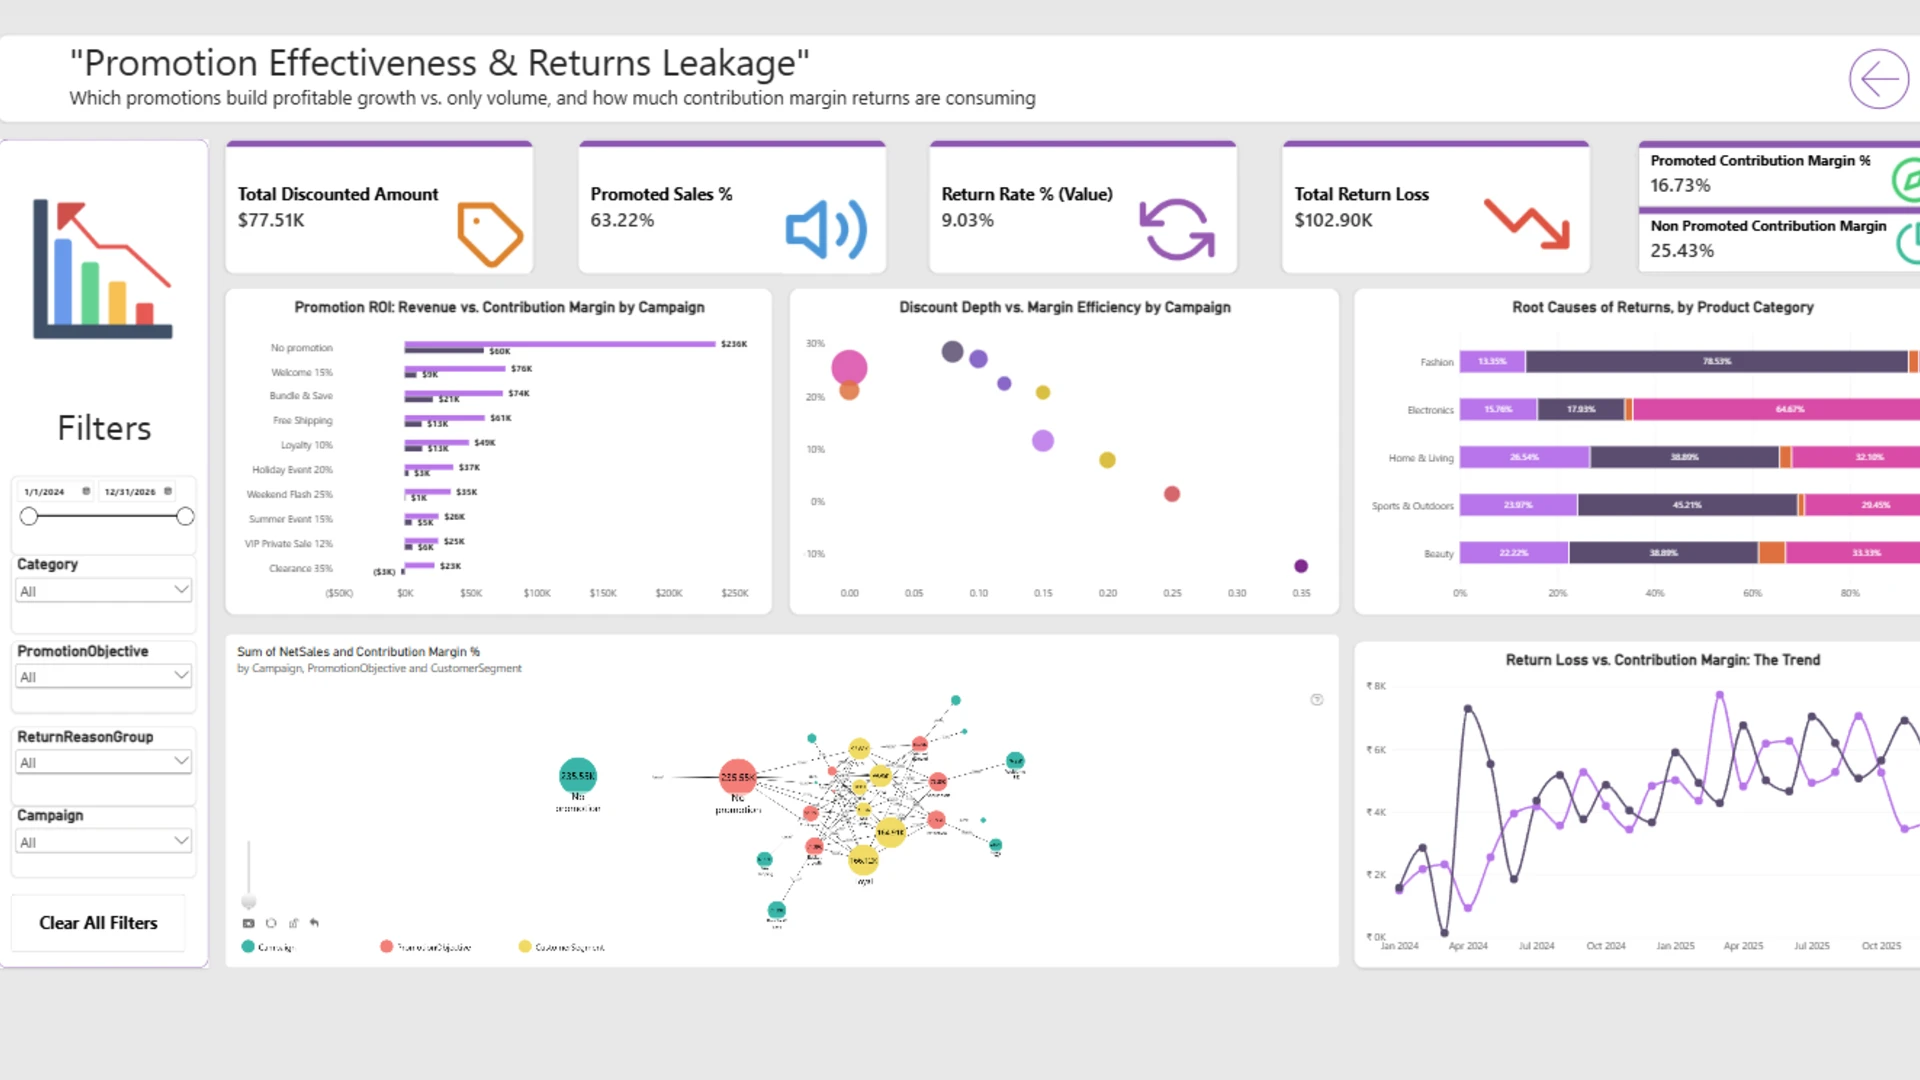
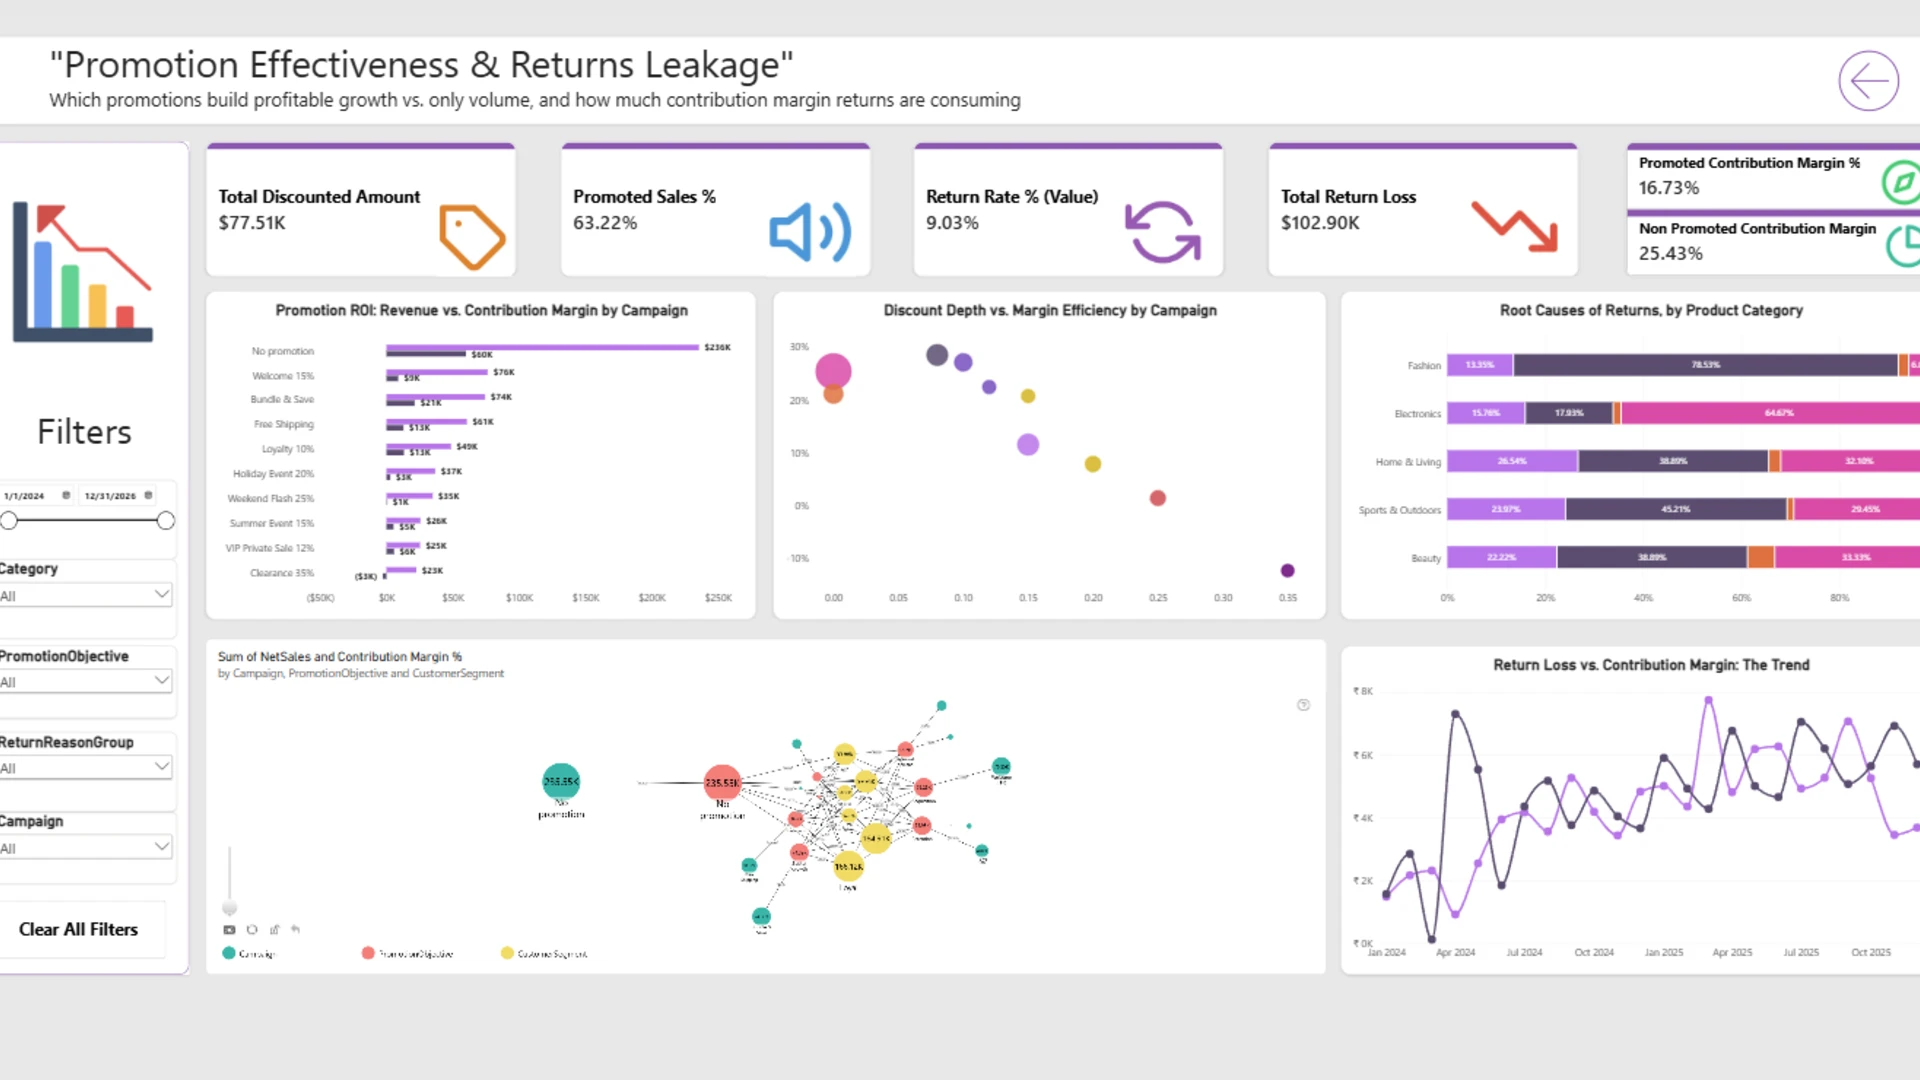
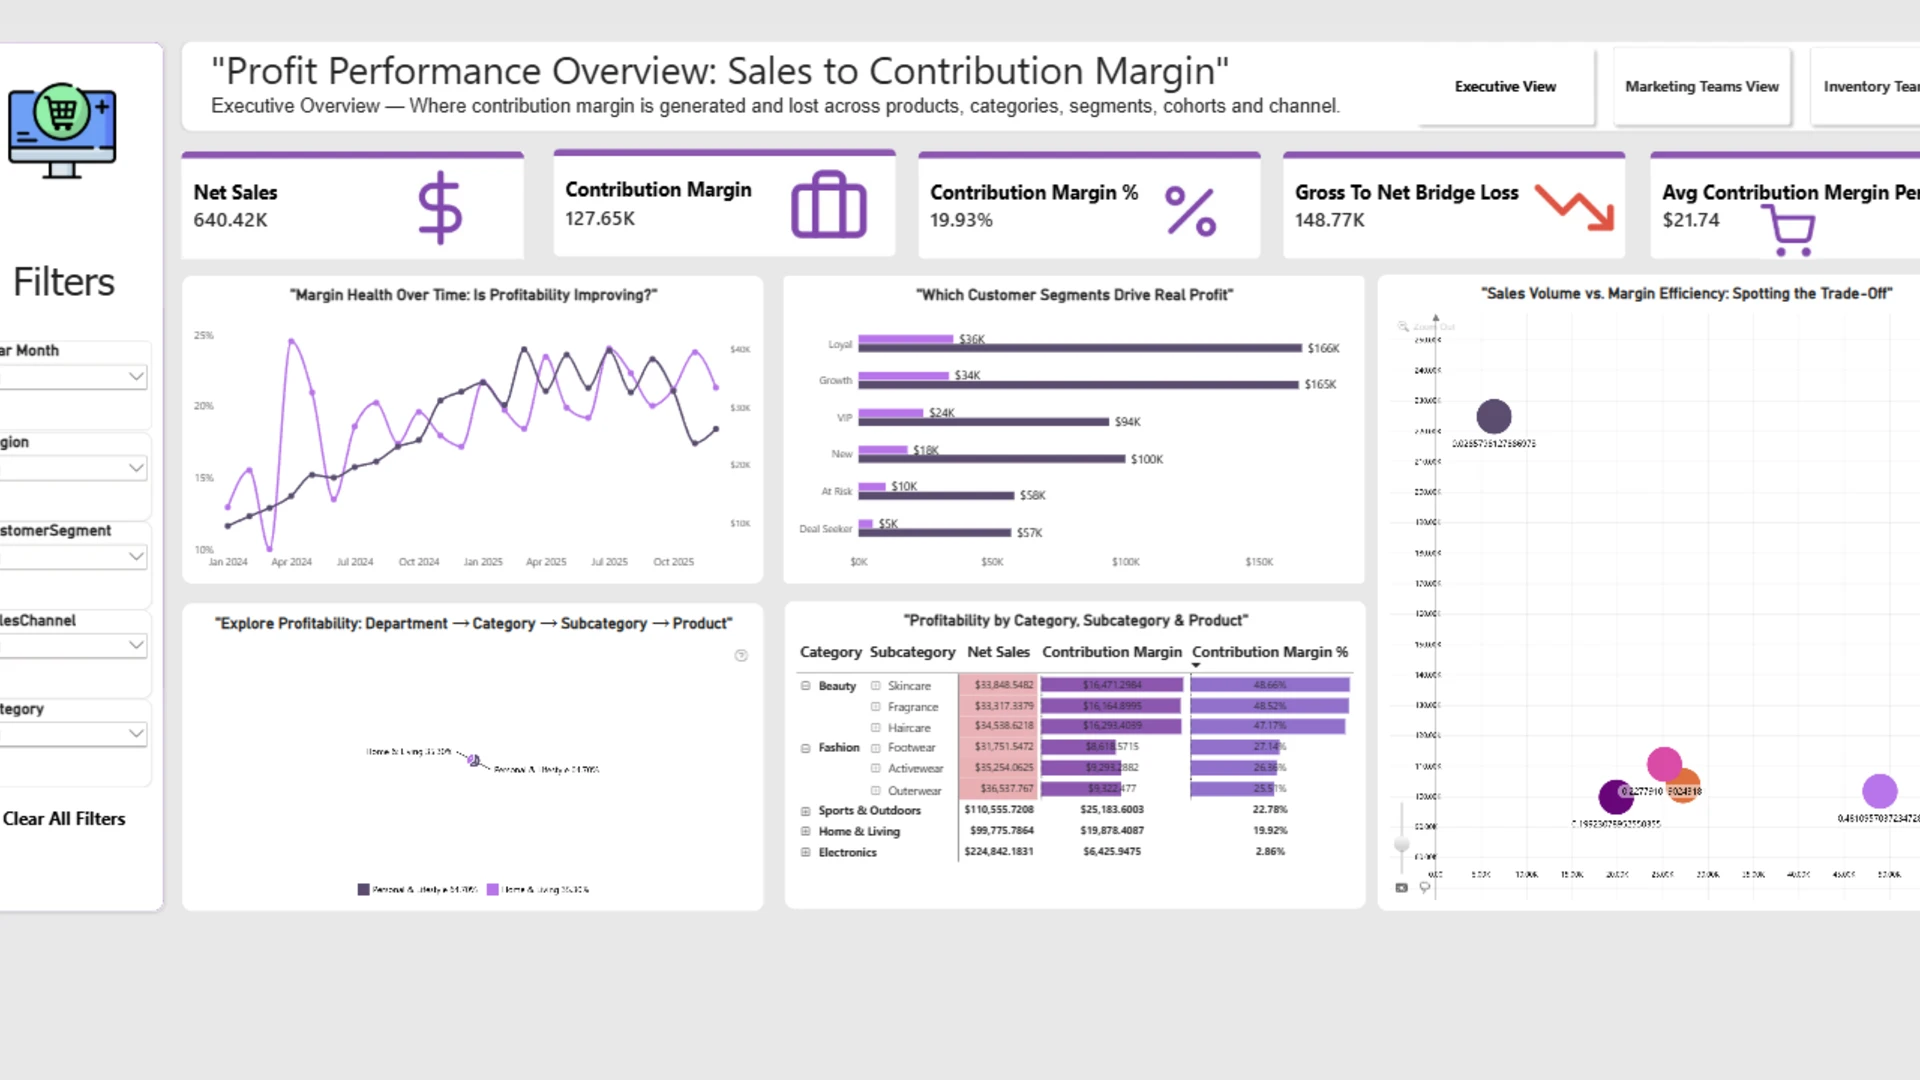
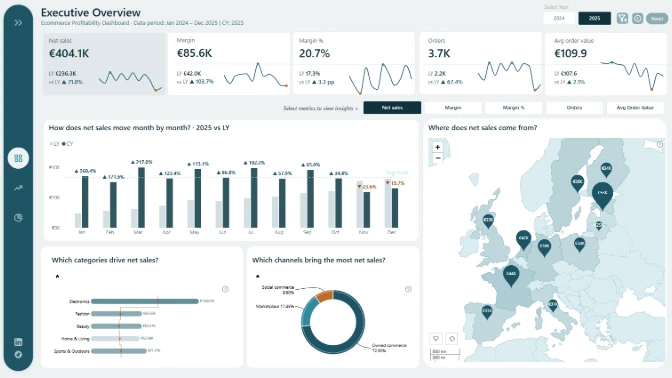
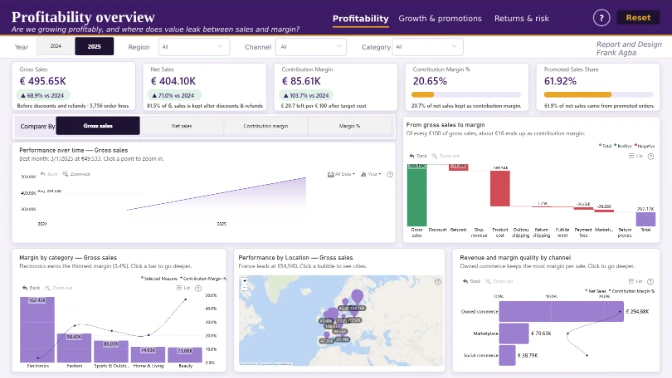
This three-page Power BI report looks at e-commerce performance from both a commercial and operational perspective.
The dashboard analyzes contribution margin, promotion performance, return-related losses, and fulfilment efficiency across more than 9,000 order lines. It connects sales, discounts, and customer cohorts with stock availability, delivery SLAs, and fulfilment costs to show where profitable growth is coming from and where value is being lost.
Users can explore performance from a high-level business view down to individual products,



4U Report Challenges
Participate in data challenges, build and submit reports to get free template downloads.
Join CommunityMobile view allows you to interact with the report. To Download the template please switch to desktop view.
How to use a PBIX template
Preview the interactive report, download the PBIX file, open it in Power BI Desktop, and replace the same data connection with your own dataset.
Preview and download
Explore the report online and download the PBIX template file.
Open in Power BI Desktop
Open the downloaded PBIX file in Power BI Desktop.
Connect your data
Replace the sample data source with your own dataset.
Refresh and adjust
Refresh the model and update fields or visual were needed.
Save and share
Save your report and publish it for your audience.


