190
Power BI E-commerce Customer Lifecycle Dashboard
Power BI E-commerce Customer Lifecycle Dashboard
More Report pages
Report Author: Douglas Atuboyedia
190
Share template with others
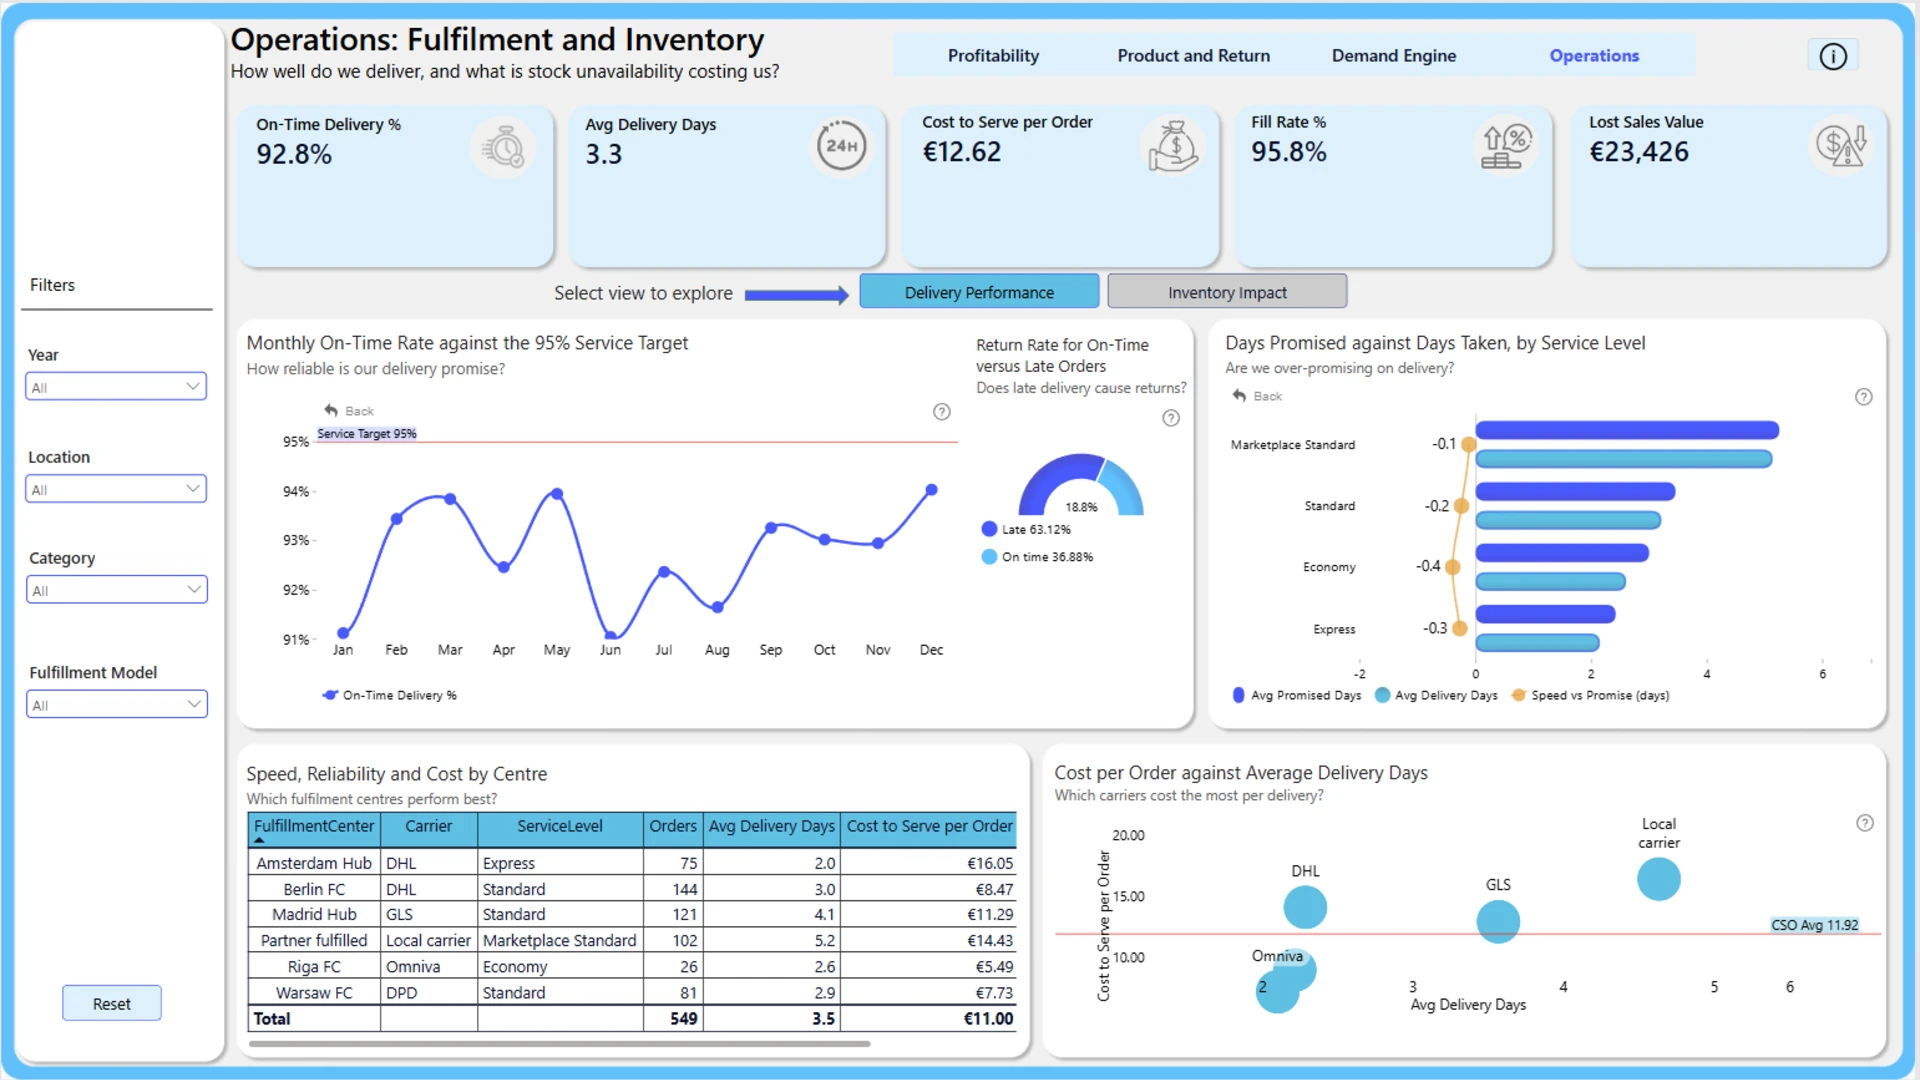
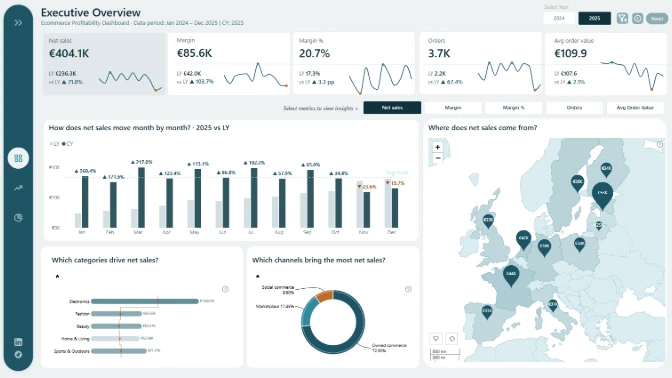
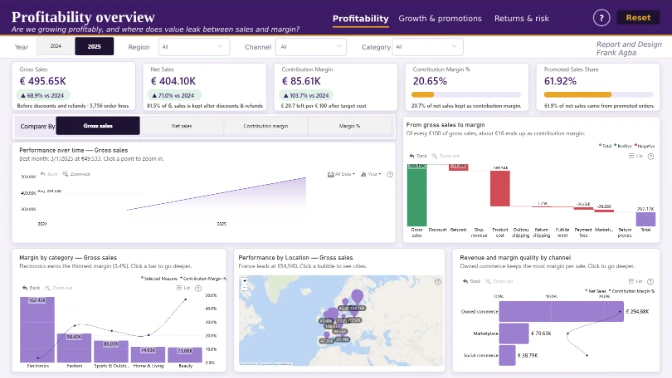
This four-page Power BI report explores e-commerce profitability across 5,873 order lines, combining sales, margin, discounts, returns, and inventory performance.
The analysis highlights several important patterns in the business.
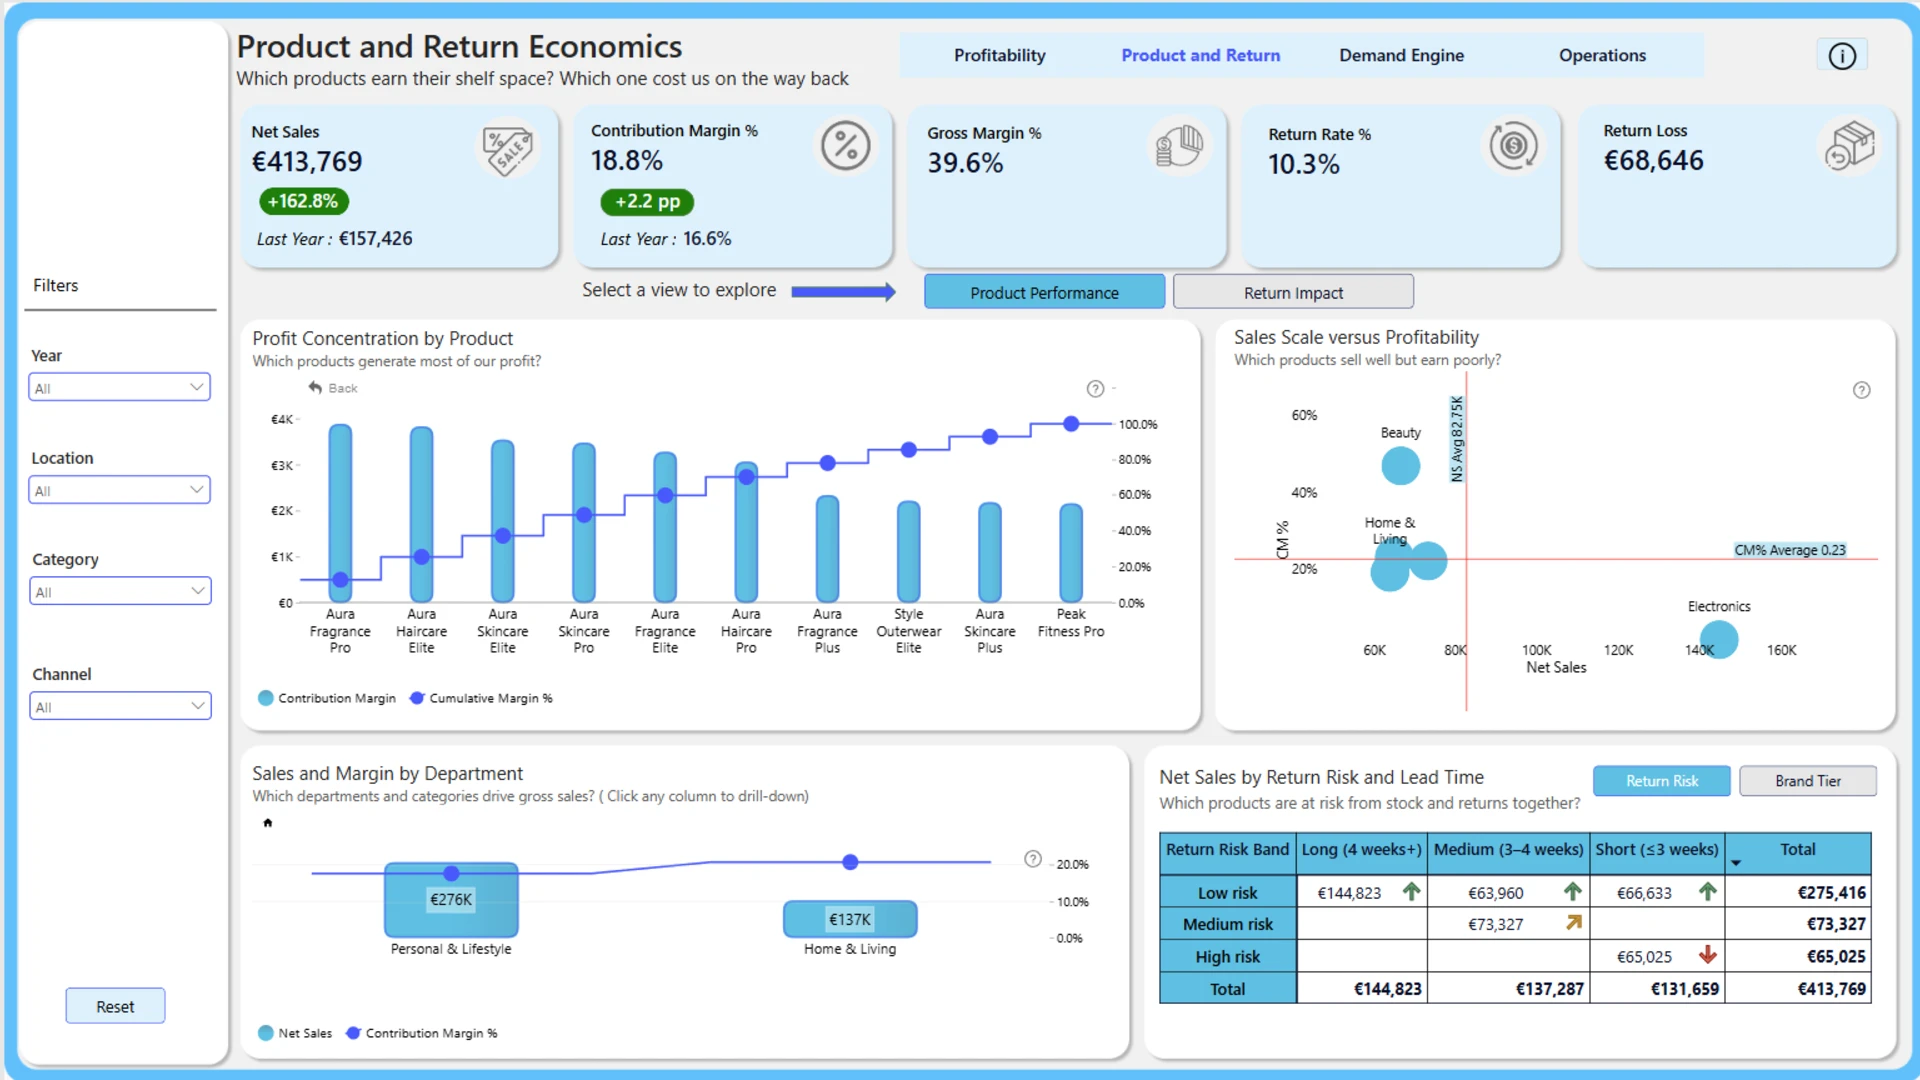
Electronics generates 35% of total revenue, but contributes only 3% of profit, showing that high sales volume does not necessarily translate into strong profitability.
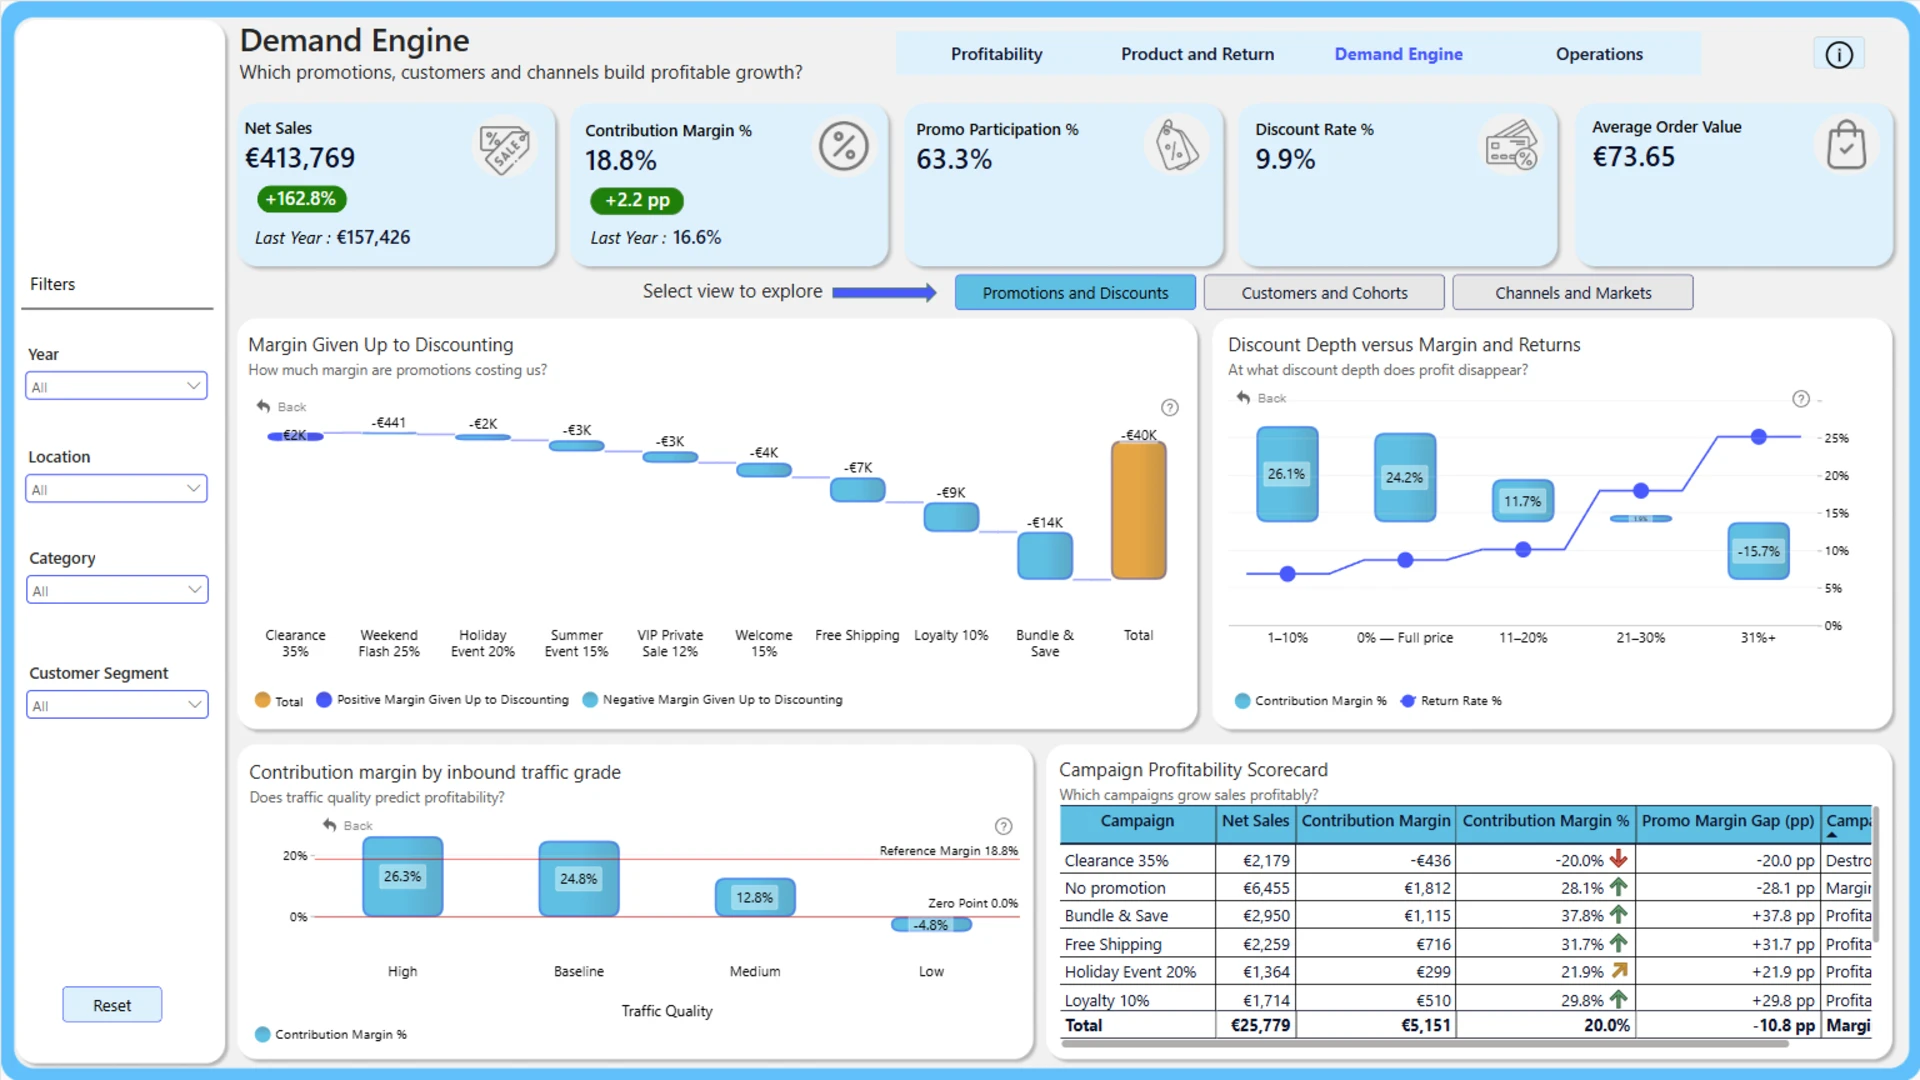
Discounting also has a clear impact on margin. Profitability is strongest in the 1–10% discount range, then falls steadily and turns negative once discounts exceed 30%.
Channel performance varies significantly as well. Marketplace sales deliver a 10.8% return compared with 23.3% for the mobile app, with payment fees accounting for much of the difference.
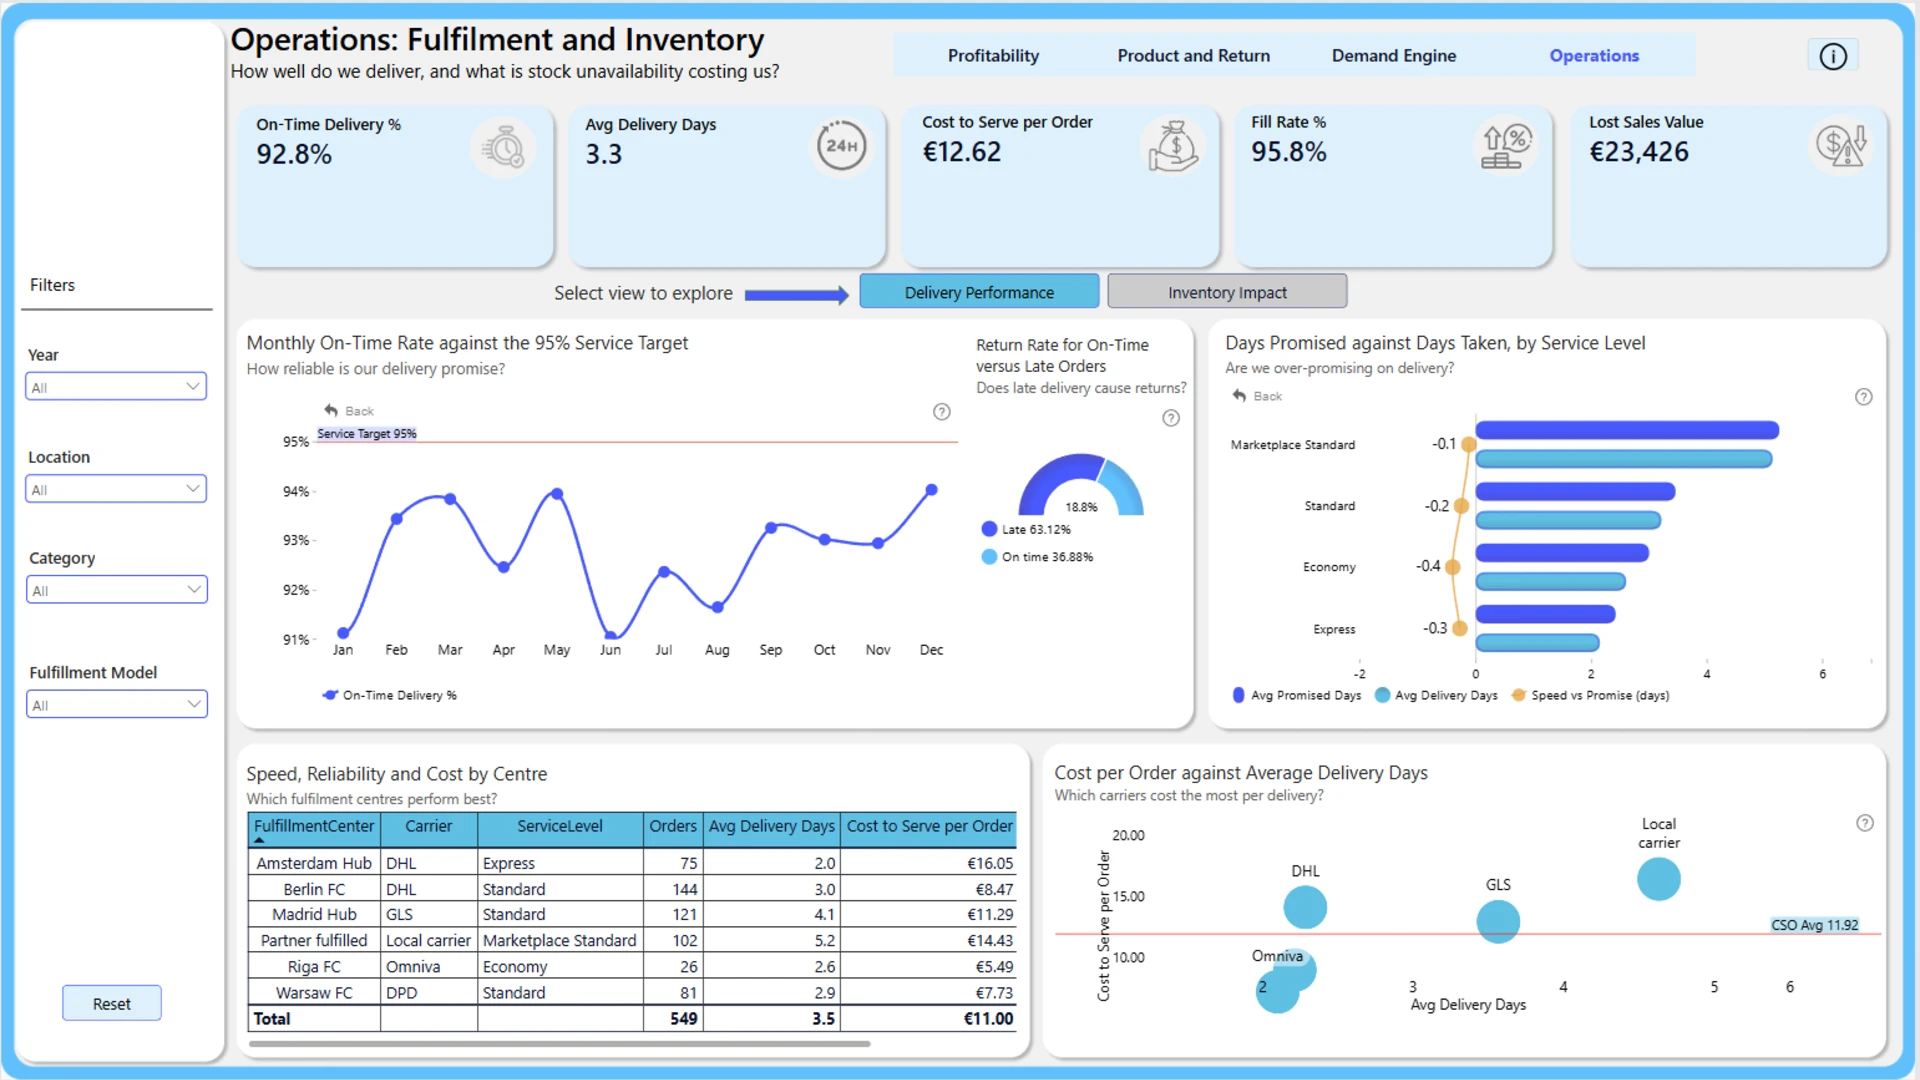
Inventory is another major issue. Every category holds less stock than required to cover its reorder lead time, which suggests that stockouts are not isolated events but a structural problem in the current supply setup.
While revenue increased by 63% and contribution margin grew by 98%, stockout-related losses rose by 241%. This shows that business growth is currently moving faster than the supply chain can support.
The report demonstrates why revenue alone does not provide the full picture. Looking at contribution margin alongside operational performance gives a much clearer view of where growth is actually creating value and where it is being lost.
ZoomCharts visuals used






4U Report Challenges
Participate in data challenges, build and submit reports to get free template downloads.
Join CommunityMobile view allows you to interact with the report. To Download the template please switch to desktop view.
How to use a PBIX template
Preview the interactive report, download the PBIX file, open it in Power BI Desktop, and replace the same data connection with your own dataset.
Preview and download
Explore the report online and download the PBIX template file.
Open in Power BI Desktop
Open the downloaded PBIX file in Power BI Desktop.
Connect your data
Replace the sample data source with your own dataset.
Refresh and adjust
Refresh the model and update fields or visual were needed.
Save and share
Save your report and publish it for your audience.


