78
Power BI Dashboard for Crude Oil Intelligence
Power BI Dashboard for Crude Oil Intelligence
More Report pages
Report Author: Joshua Achire
78
Share template with others
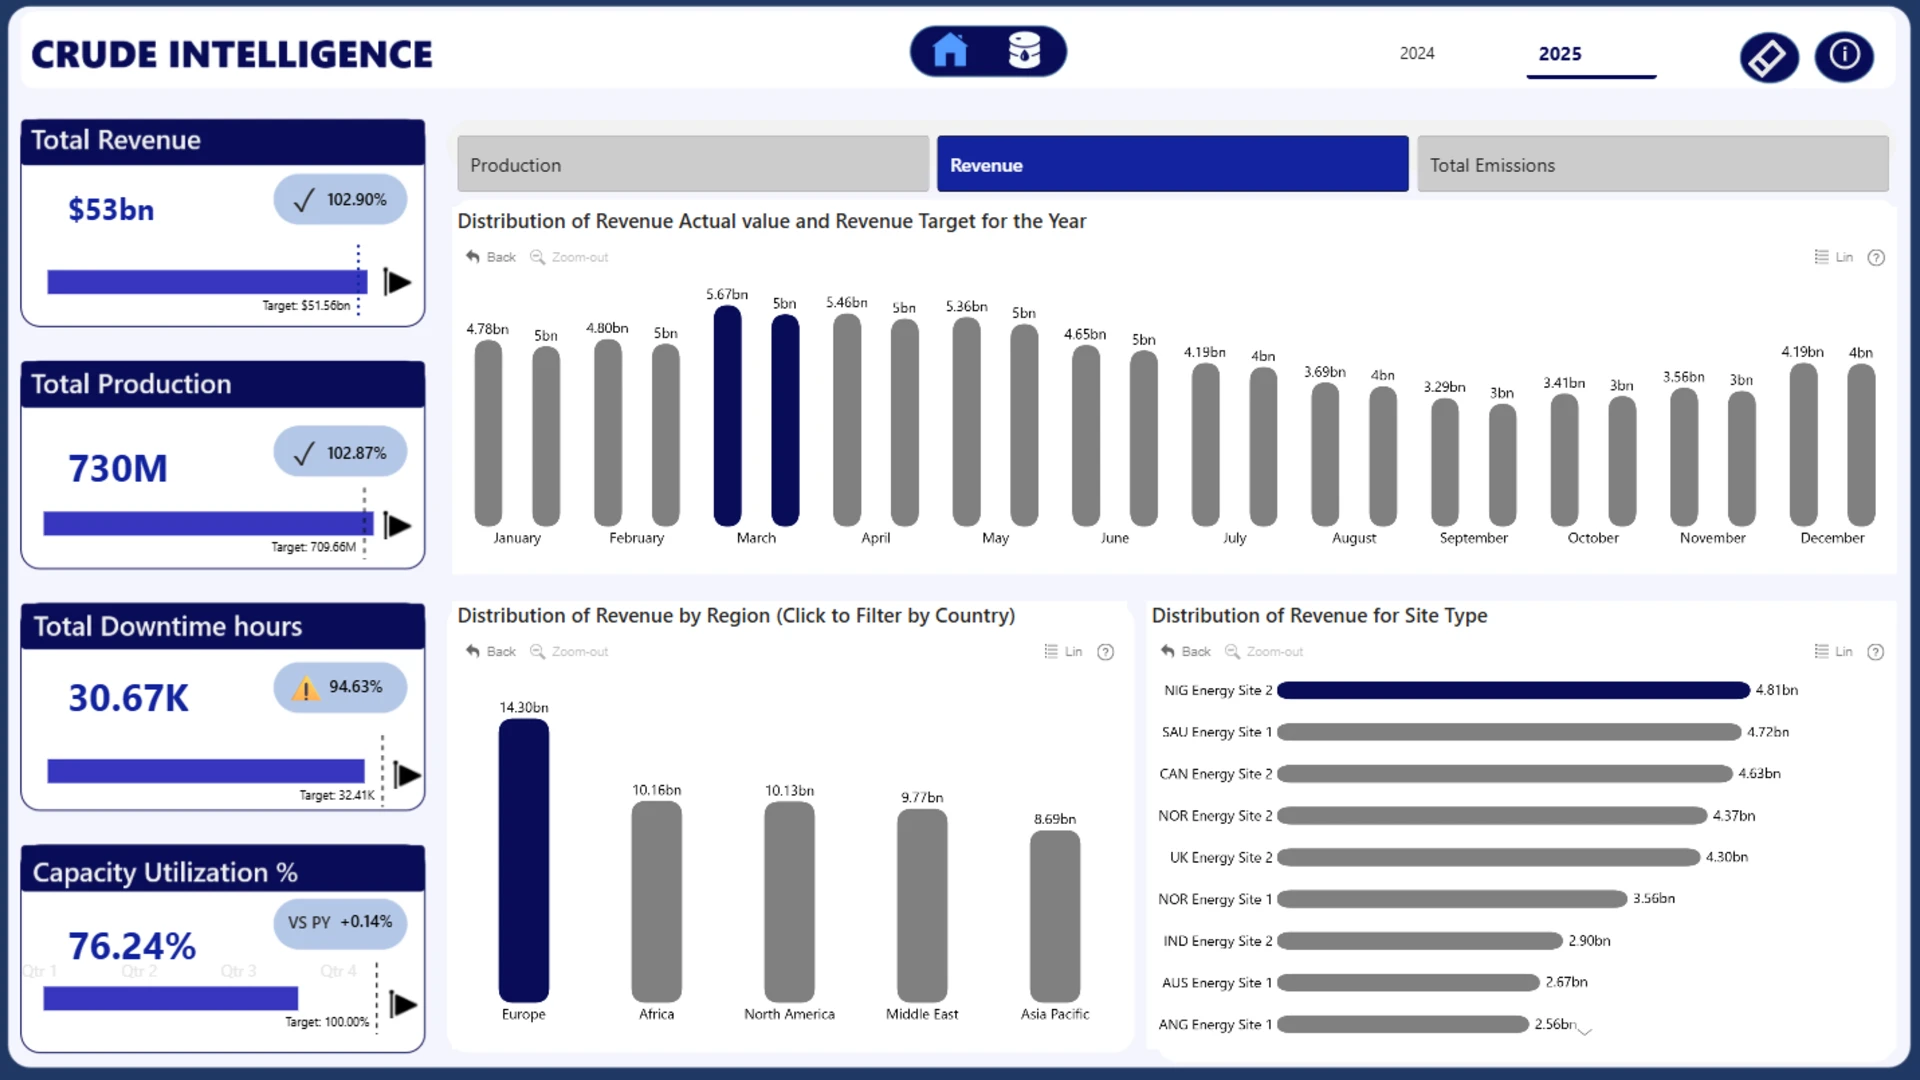
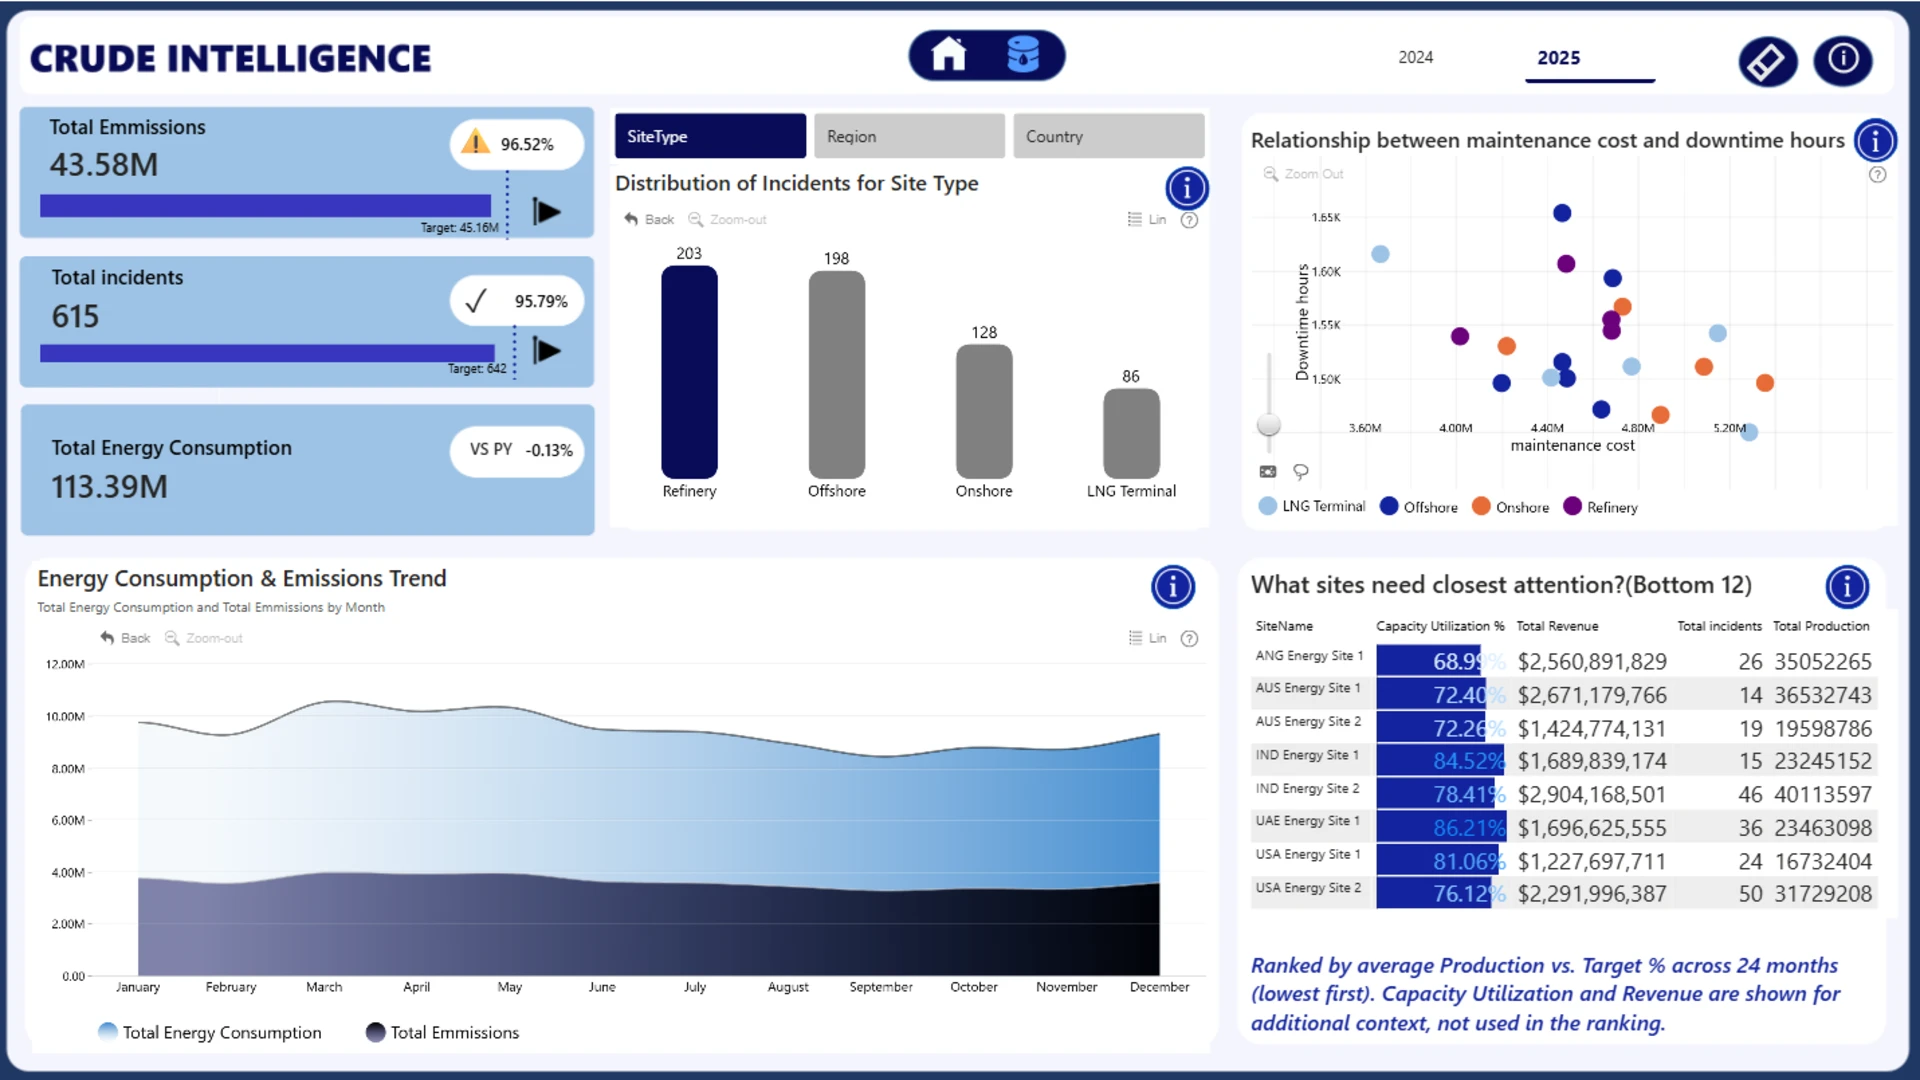
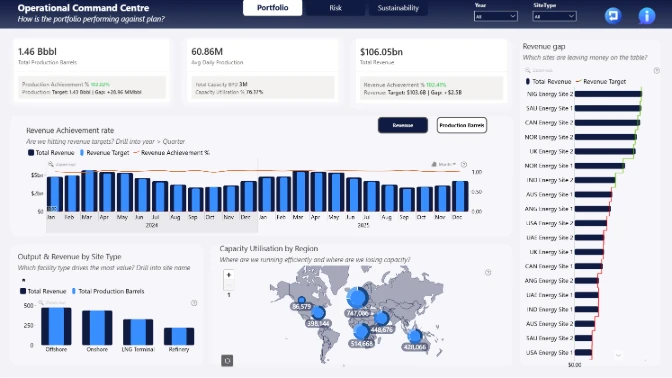
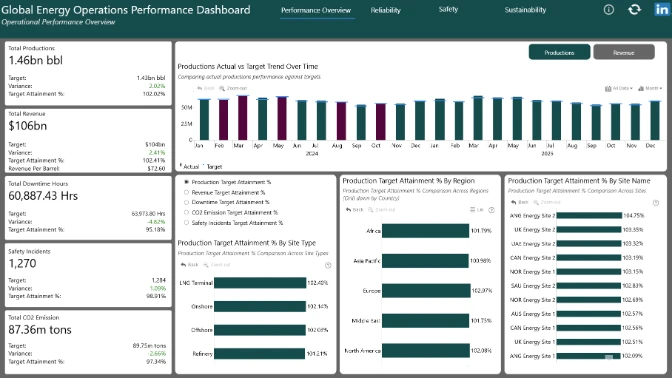
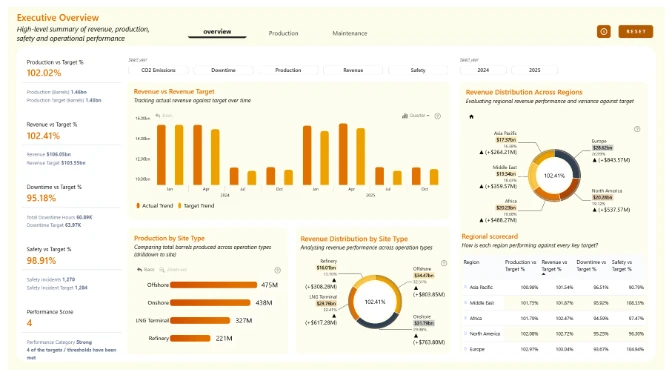
Crude Intelligence is an interactive Power BI dashboard that tracks production, revenue, safety, operational, and sustainability performance across 20 energy sites, including Offshore, Onshore, Refinery, and LNG operations.
Report overview:
-
Page 1: Executive dashboard providing a high-level view of production, revenue, capacity utilization, and KPI performance against targets.
-
Page 2: Operational analytics focused on risk assessment, safety incidents, maintenance effectiveness, and identifying sites that require immediate attention.
Interactive features:
-
Filter by year using the Year Selector.
-
Analyze performance by Site Type, Region, or Country using the dimension tabs.
-
Click charts to drill from portfolio-level insights down to individual sites with ZoomCharts Drill Down visuals.
This report was created for the ZoomCharts 4U Report Challenge – June 2026, where Power BI developers demonstrate their data visualization and analytics expertise by solving real-world business scenarios using native Power BI visuals together with ZoomCharts Drill Down Visuals.
4U Report Challenges
Participate in data challenges, build and submit reports to get free template downloads.
Join CommunityMobile view allows you to interact with the report. To Download the template please switch to desktop view.
Was this helpful? Thank you for your feedback!
Sorry about that.
How can we improve it?