679
Power BI B2B Sales Dashboard
Power BI B2B Sales Dashboard
More Report pages
Report Author: Odunlami Zainab
679
Share template with others
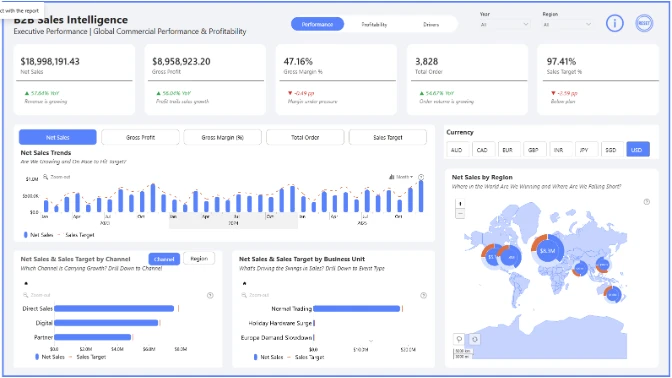
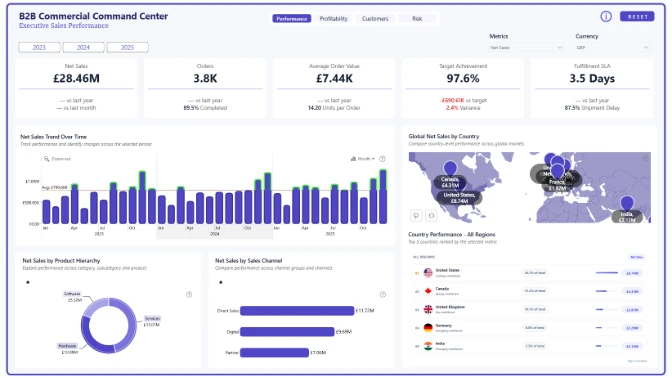
This interactive Power BI B2B sales dashboard analyzes net sales, order volume, average order value, profitability, targets, customers, products, channels, sales teams, and returns across global markets.
Submitted to the ZoomCharts 4U Report Challenge August 2026, the report uses Power BI and ZoomCharts Drill Down visuals to analyze the global B2B sales dataset.
B2B Sales Performance Dashboard
An interactive B2B Sales Performance Dashboard designed to provide a comprehensive view of sales performance, profitability, commercial effectiveness, and individual salesperson contribution.
The dashboard follows a four-page analytical journey, moving from a high-level executive overview to the drivers behind financial and commercial performance, and finally to individual salesperson results.
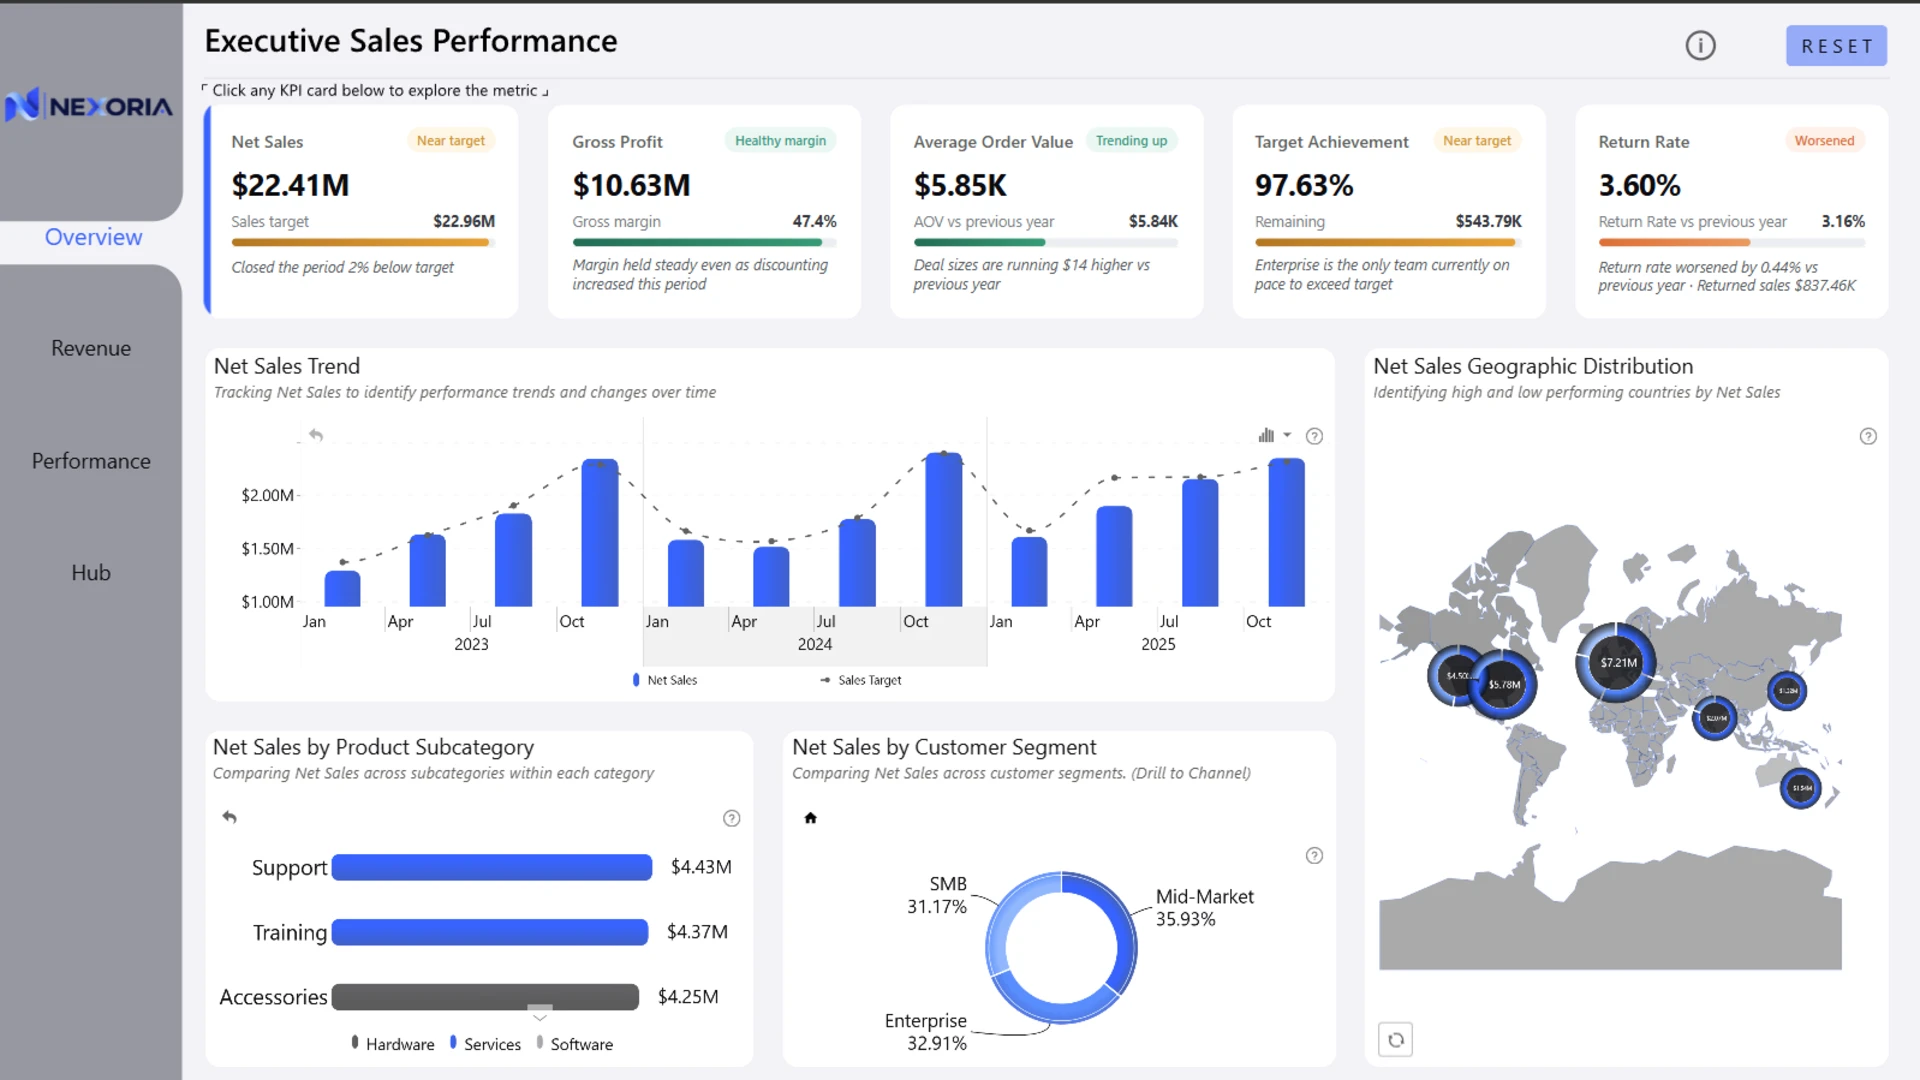
Page 1 — Executive Sales Performance
Monitor overall sales performance, revenue trends, and target achievement to answer:
What happened?
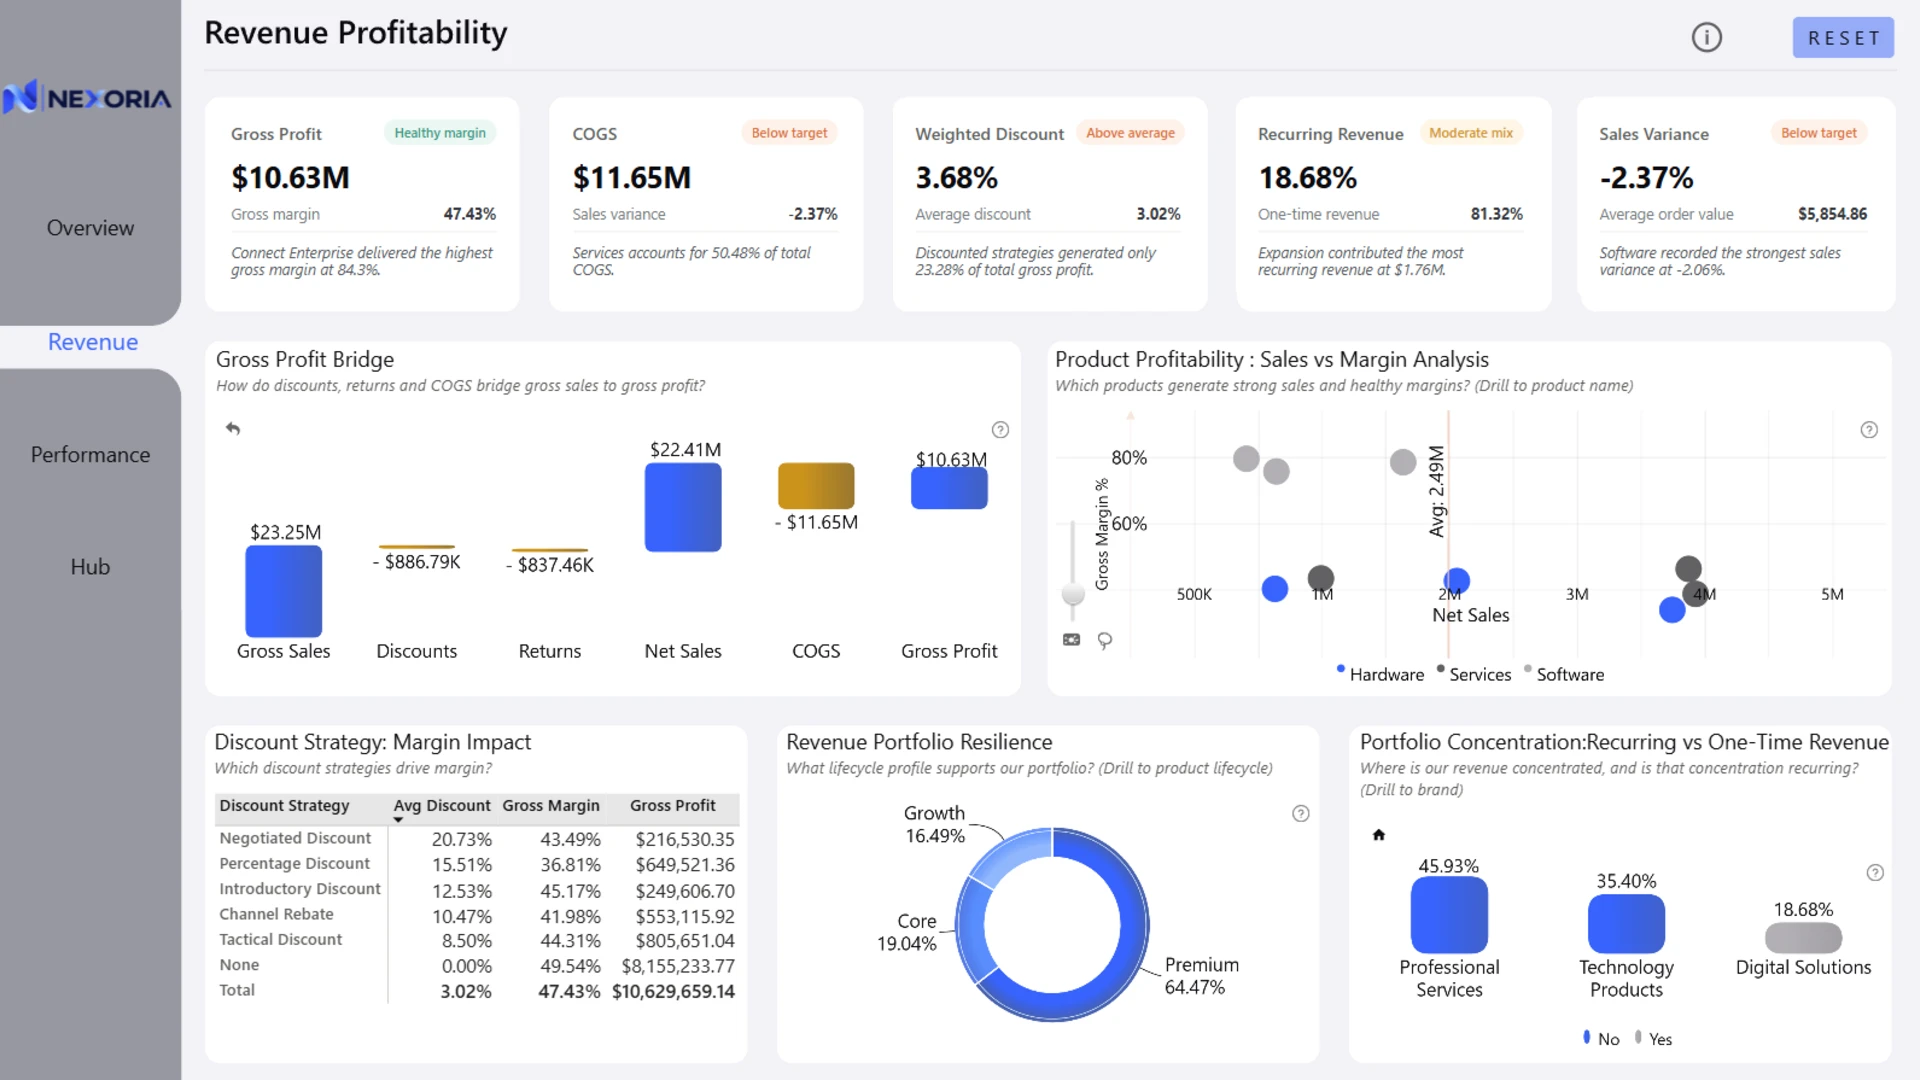
Page 2 — Revenue & Profitability
Analyze revenue, gross profit, margins, costs, and product contribution to answer:
Where is the value and profitability coming from?
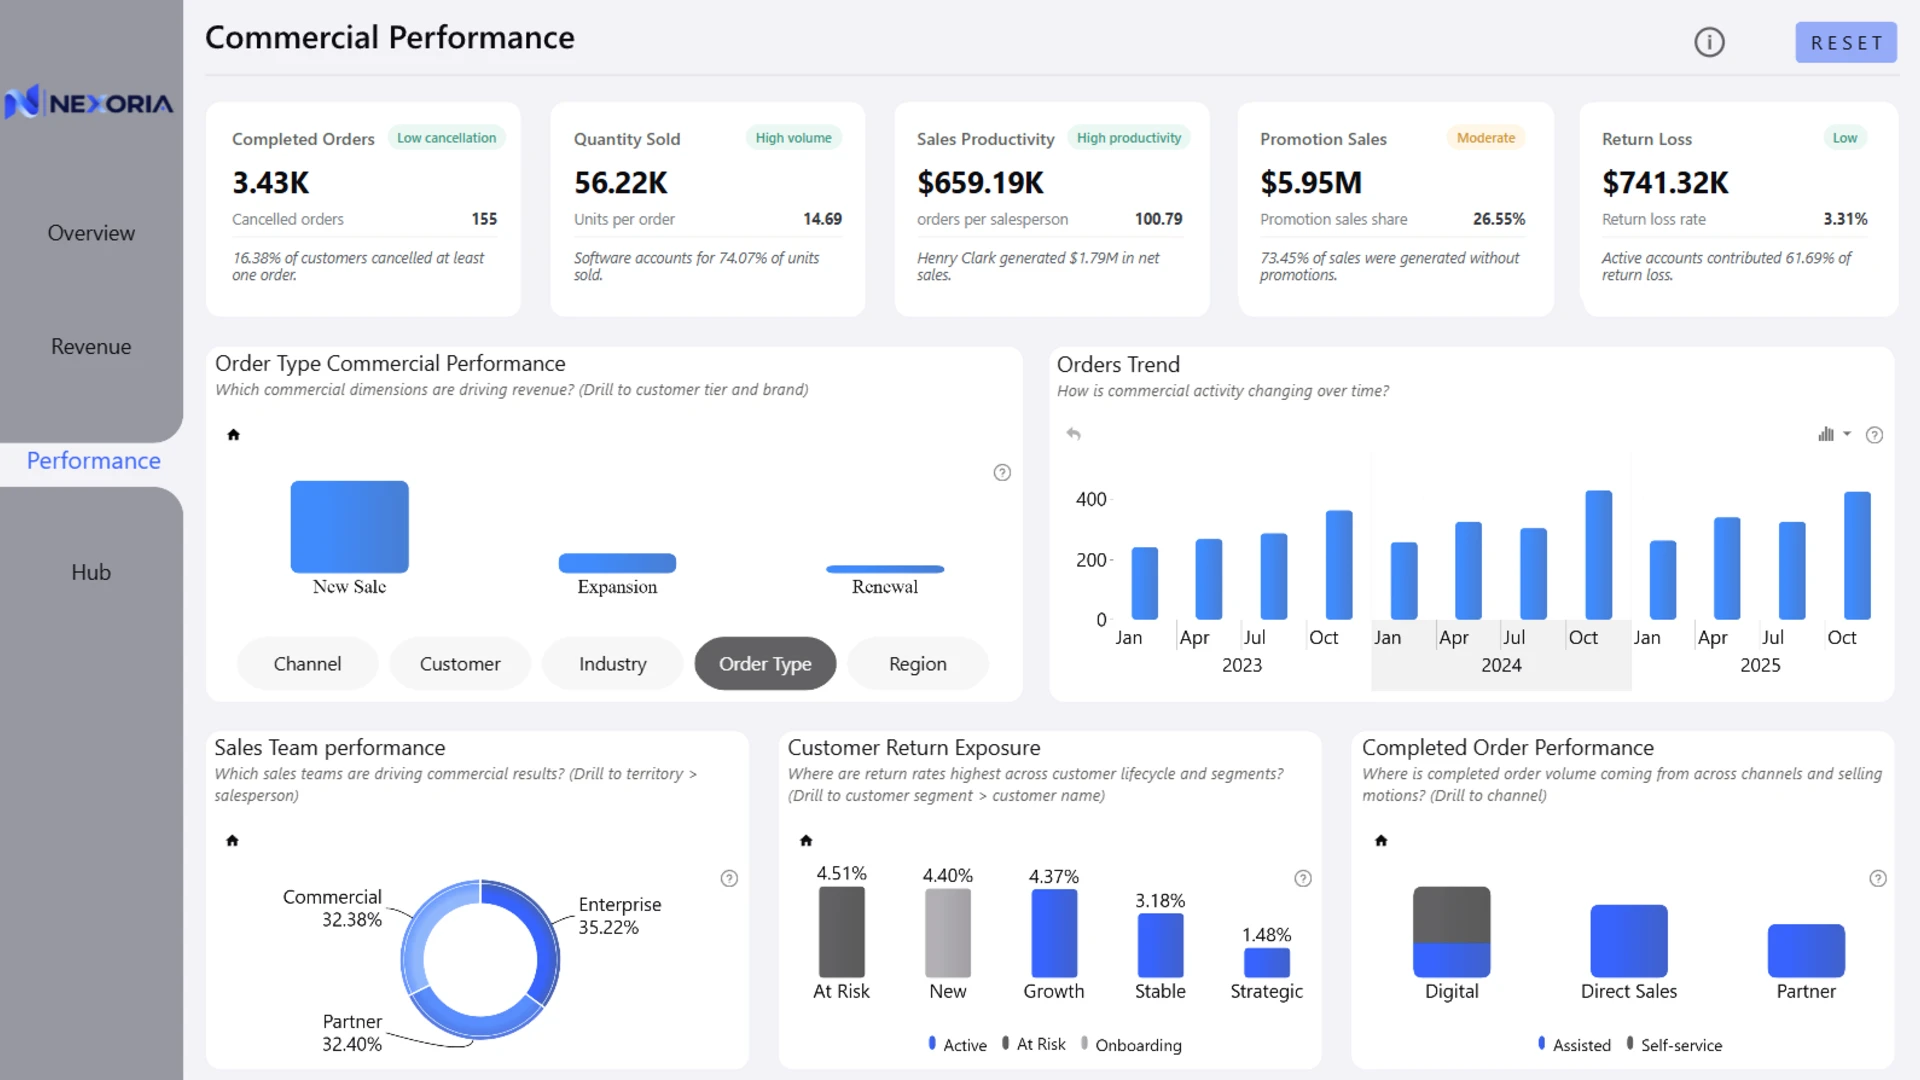
Page 3 — Commercial Performance
Evaluate performance across markets, customers, channels, promotions, and sales teams, while identifying the factors influencing commercial outcomes. This page answers:
Who and where is performance coming from, and what is influencing the results?
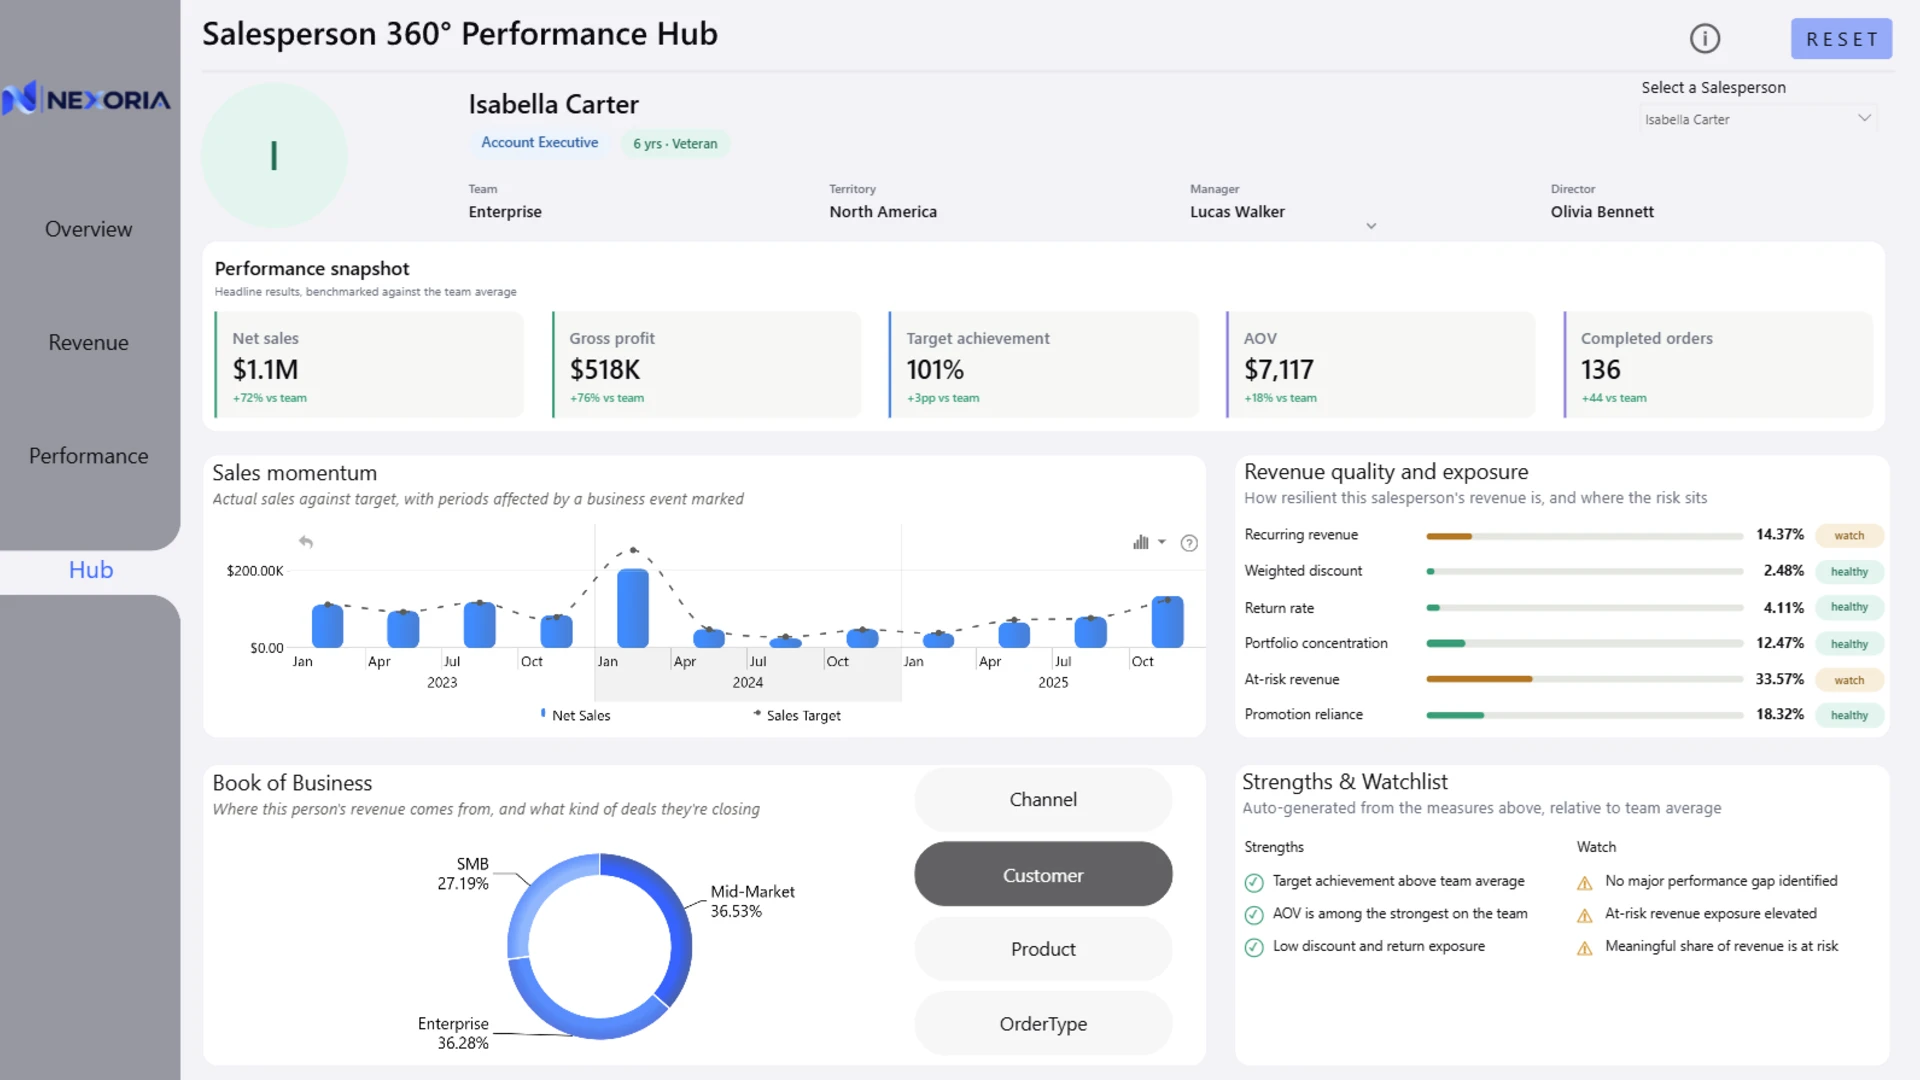
Page 4 — Sales Performance Hub
Drill into individual salesperson performance, customer portfolios, product contribution, and commercial impact to answer:
Who is driving the results, and how are they performing?
Analytical Flow
WHAT happened?
→ Executive Sales Performance
WHERE is the value coming from?
→ Revenue & Profitability
WHO and WHERE is performing, and WHAT is influencing the results?
→ Commercial Performance
WHO is driving the results, and HOW are they performing?
→ Sales Performance Hub
This creates a clear analytical progression:
Executive overview → Financial value → Commercial drivers → Individual performance
Rather than functioning as four separate reports, the pages work together as a connected analytical journey, helping users move from understanding what happened to identifying where value comes from, what drives performance, and who contributes to the results.
ZoomCharts visuals used







4U Report Challenges
Participate in data challenges, build and submit reports to get free template downloads.
Join CommunityMobile view allows you to interact with the report. To Download the template please switch to desktop view.
How to use a PBIX template
Preview the interactive report, download the PBIX file, open it in Power BI Desktop, and replace the same data connection with your own dataset.
Preview and download
Explore the report online and download the PBIX template file.
Open in Power BI Desktop
Open the downloaded PBIX file in Power BI Desktop.
Connect your data
Replace the sample data source with your own dataset.
Refresh and adjust
Refresh the model and update fields or visual were needed.
Save and share
Save your report and publish it for your audience.


