582
Pharmacy Sales and Profitability Analysis 14
Pharmacy Sales and Profitability Analysis 14
Report Author: Yasmeen Amjad
582
Share template with others
This Power BI report uses the Pharmacy Sales and Profitability dataset. The report features ZoomCharts Drill Down PRO custom visuals for Power BI. It was submitted to the Onyx Data DataDNA ZoomCharts Mini Challenge in January - February 2026.
Author’s Description:
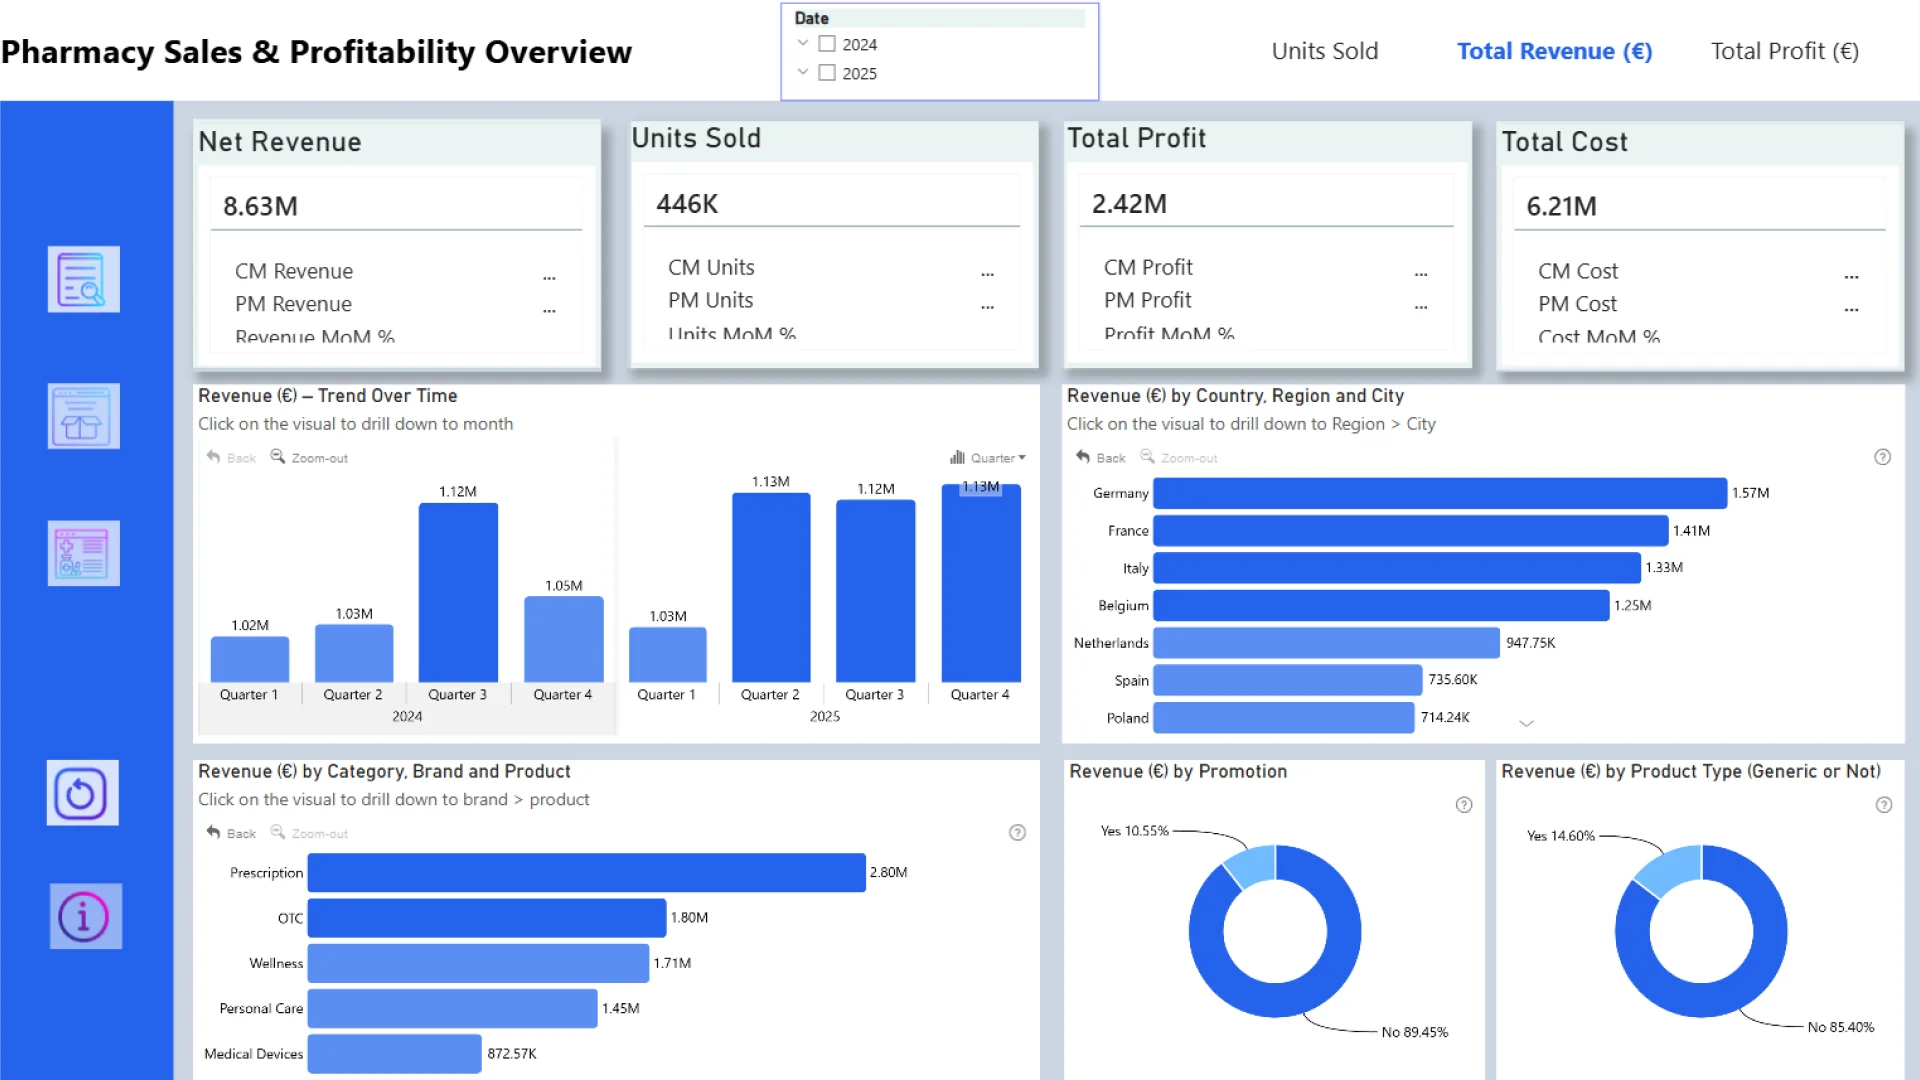
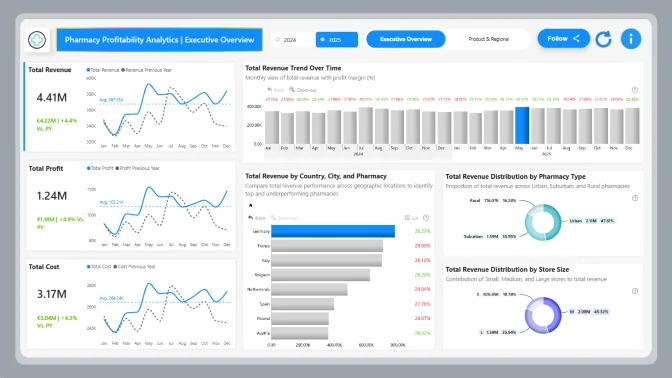
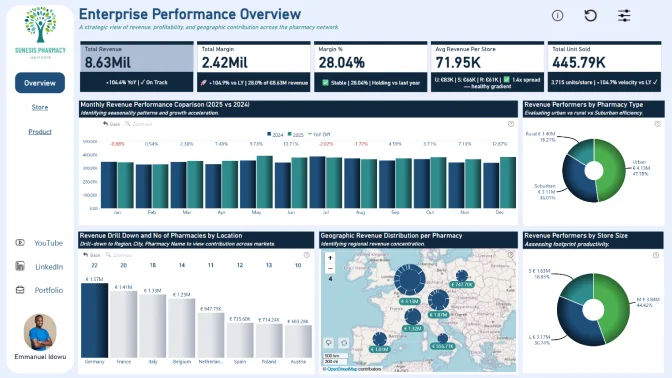
This analysis evaluates sales performance across time, geography, pharmacies, and products to uncover trends and profitability drivers. It highlights how revenue, units sold, and margins vary by region, pharmacy type, and promotion status. The report identifies top-performing products, brands, and locations while also revealing underperforming areas. Drill-down capabilities enable deeper insights from the country level to individual pharmacies. Overall, the dashboard supports data-driven decision-making by providing clear visibility into business performance patterns.
ZoomCharts visuals used
4U Report Challenges
Participate in data challenges, build and submit reports to get free template downloads.
Join CommunityMobile view allows you to interact with the report. To Download the template please switch to desktop view.

Was this helpful? Thank you for your feedback!
Sorry about that.
How can we improve it?