1123
Pharma Sales Power BI Dashboard 16
Pharma Sales Power BI Dashboard 16
More Report pages
Report Author: Victor Ofori Asante
1123
Share template with others
This Power BI report uses the Pharmacy Sales and Profitability dataset. The report features ZoomCharts Drill Down PRO custom visuals for Power BI. It was submitted to the Onyx Data DataDNA ZoomCharts Mini Challenge in January - February 2026.
Author’s Description:
European Pharmacy Analysis Summary
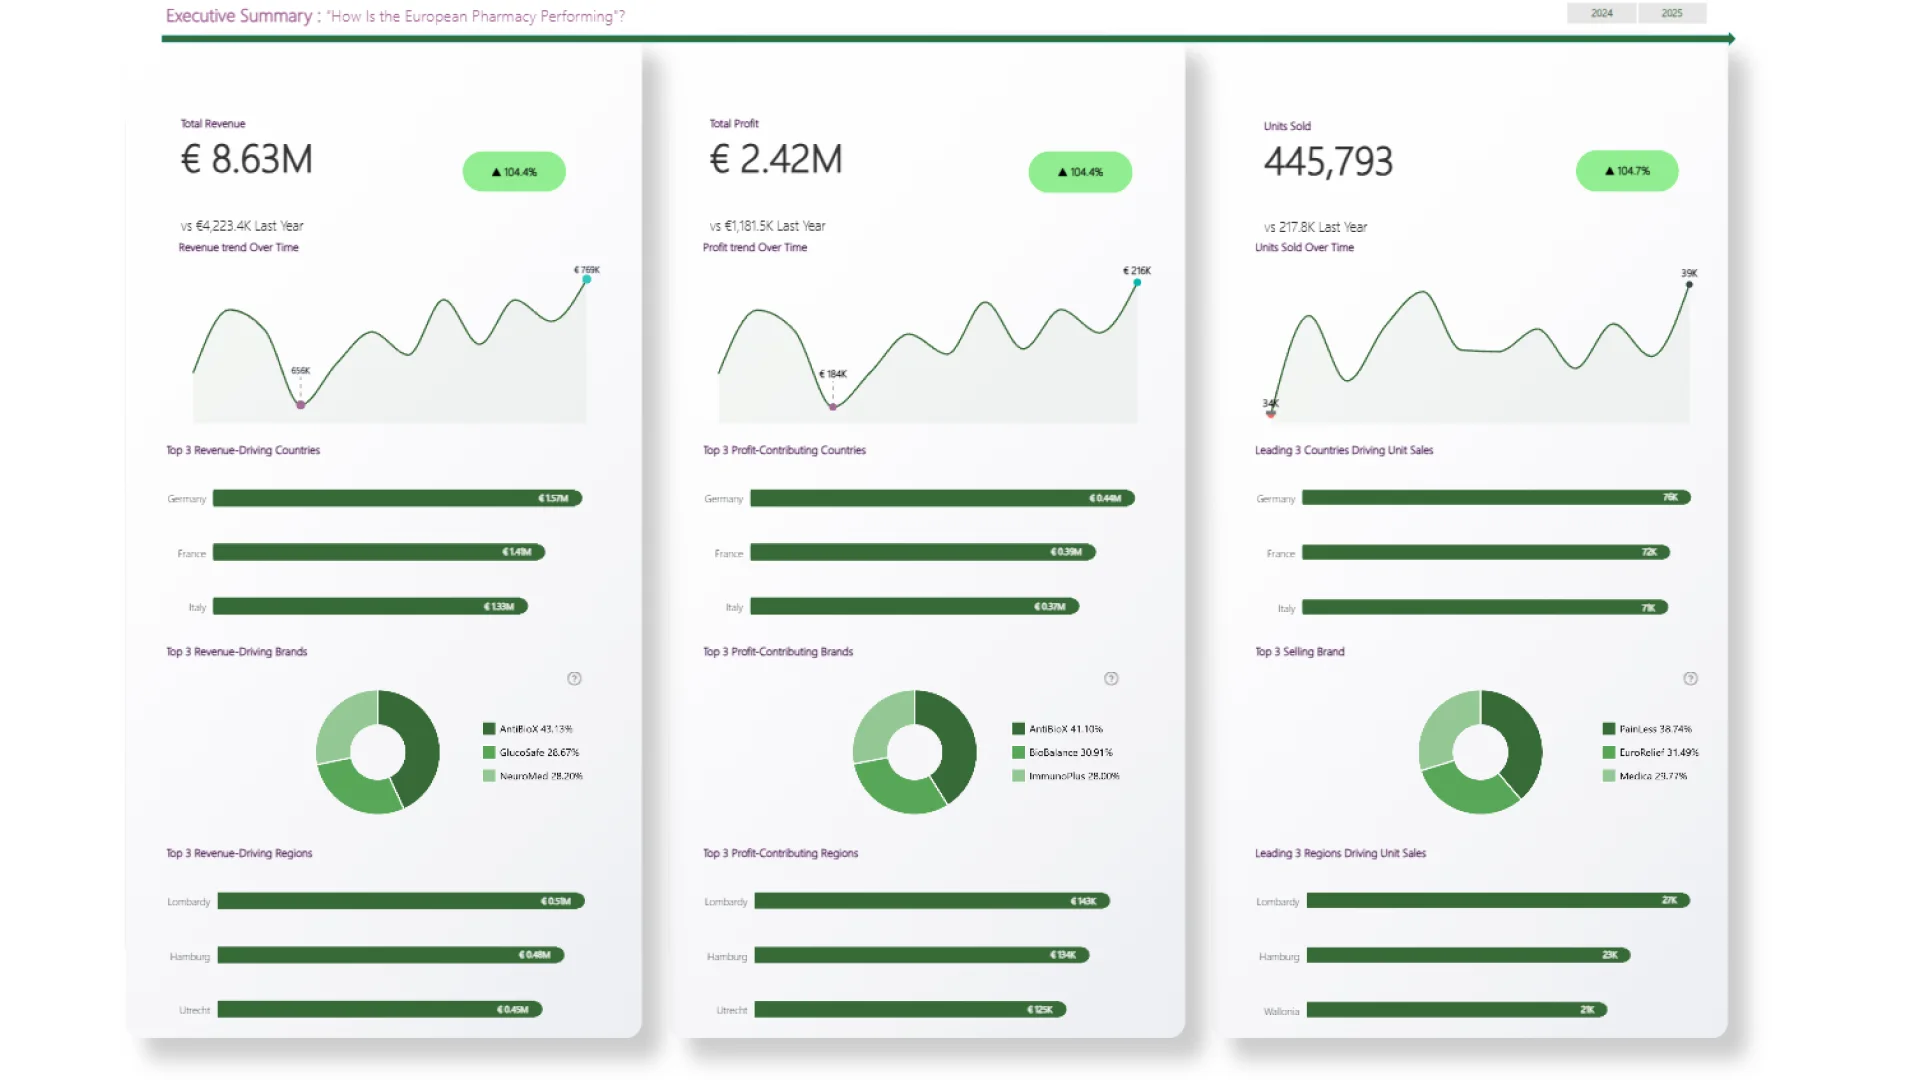
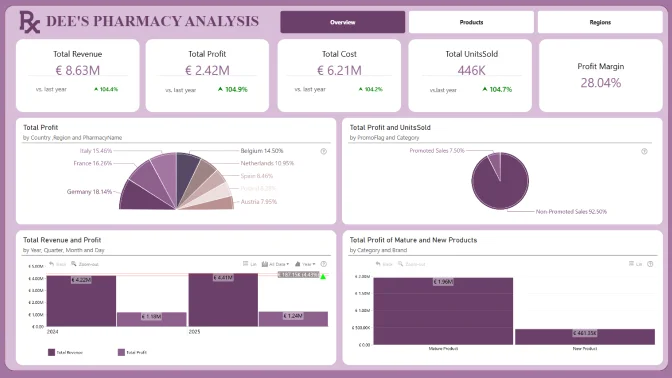
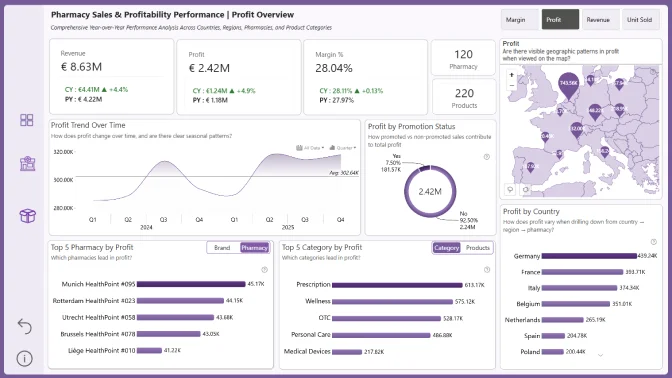
Financial Growth: Total profit reached €2.42M, representing a 104.4% increase over the previous year.
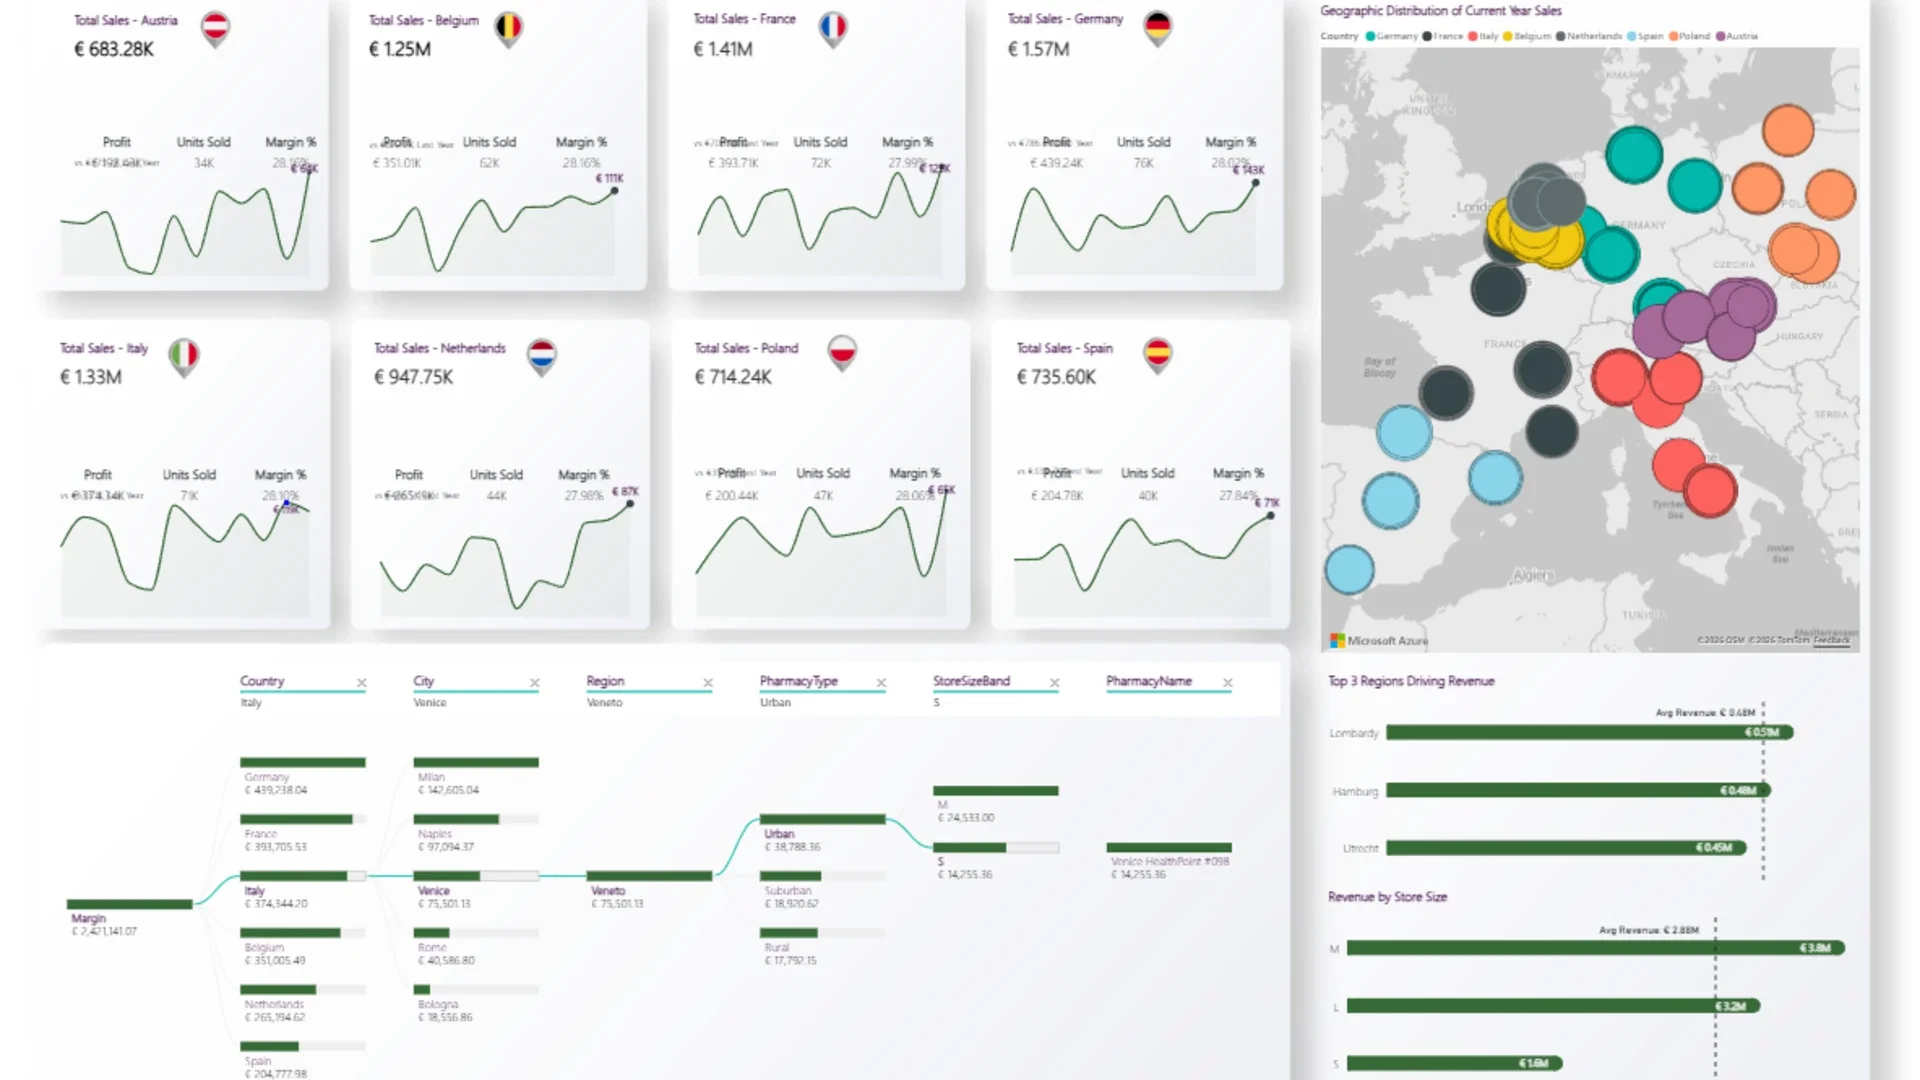
Key Markets: Germany leads in both revenue and profit, followed by France and Italy.
Top Products: AntiBioX is the leading brand, contributing 43.13% of total profit.
Store Performance: Medium-sized stores generate the highest revenue at €3.8M.
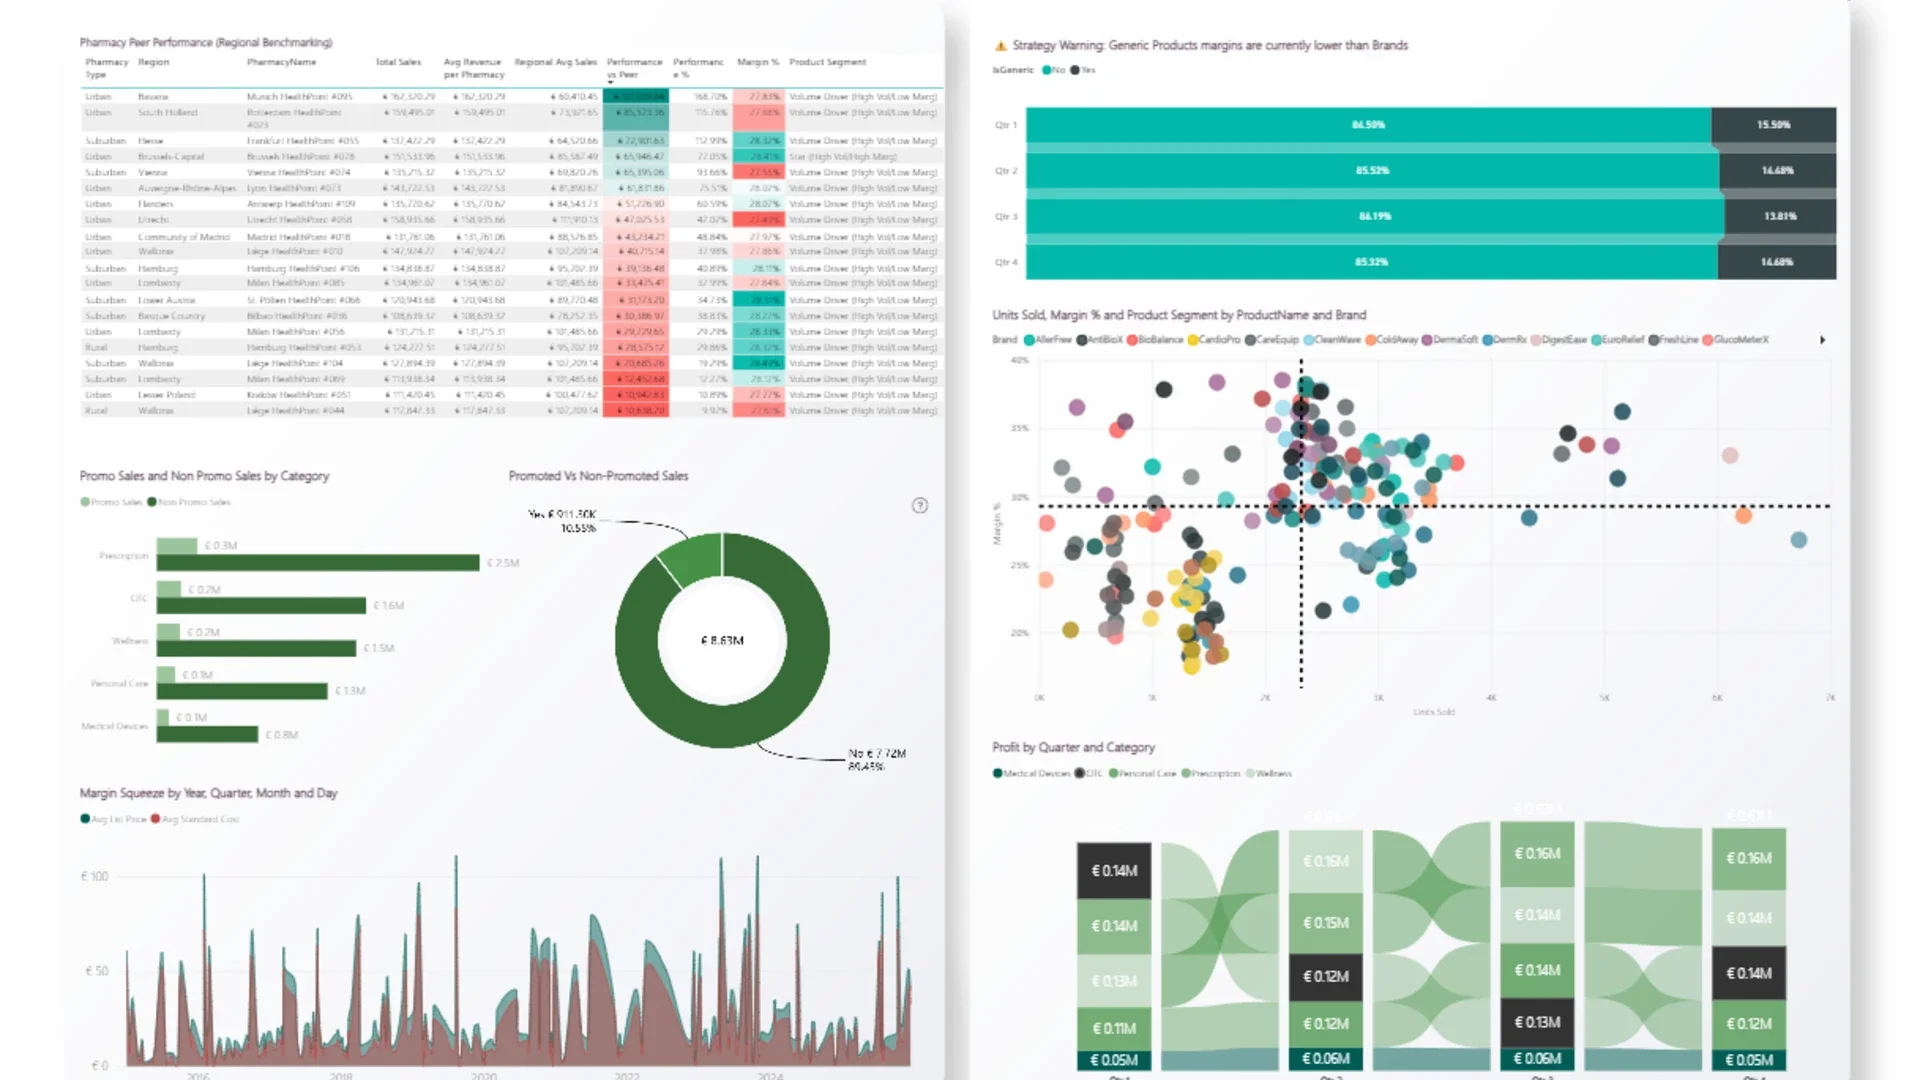
Sales Strategy: 89.45% of sales are non-promoted, and Prescription products represent the highest-earning category.
Margin Insight: Generic product margins are currently lower than those of branded products.
ZoomCharts visuals used

4U Report Challenges
Participate in data challenges, build and submit reports to get free template downloads.
Join CommunityMobile view allows you to interact with the report. To Download the template please switch to desktop view.
How to use a PBIX template
Preview the interactive report, download the PBIX file, open it in Power BI Desktop, and replace the same data connection with your own dataset.
Preview and download
Explore the report online and download the PBIX template file.
Open in Power BI Desktop
Open the downloaded PBIX file in Power BI Desktop.
Connect your data
Replace the sample data source with your own dataset.
Refresh and adjust
Refresh the model and update fields or visual were needed.
Save and share
Save your report and publish it for your audience.


