359
Patient Flow Optimization Power BI Report
Patient Flow Optimization Power BI Report
More Report pages
Report Author: David Agboola
359
Share template with others
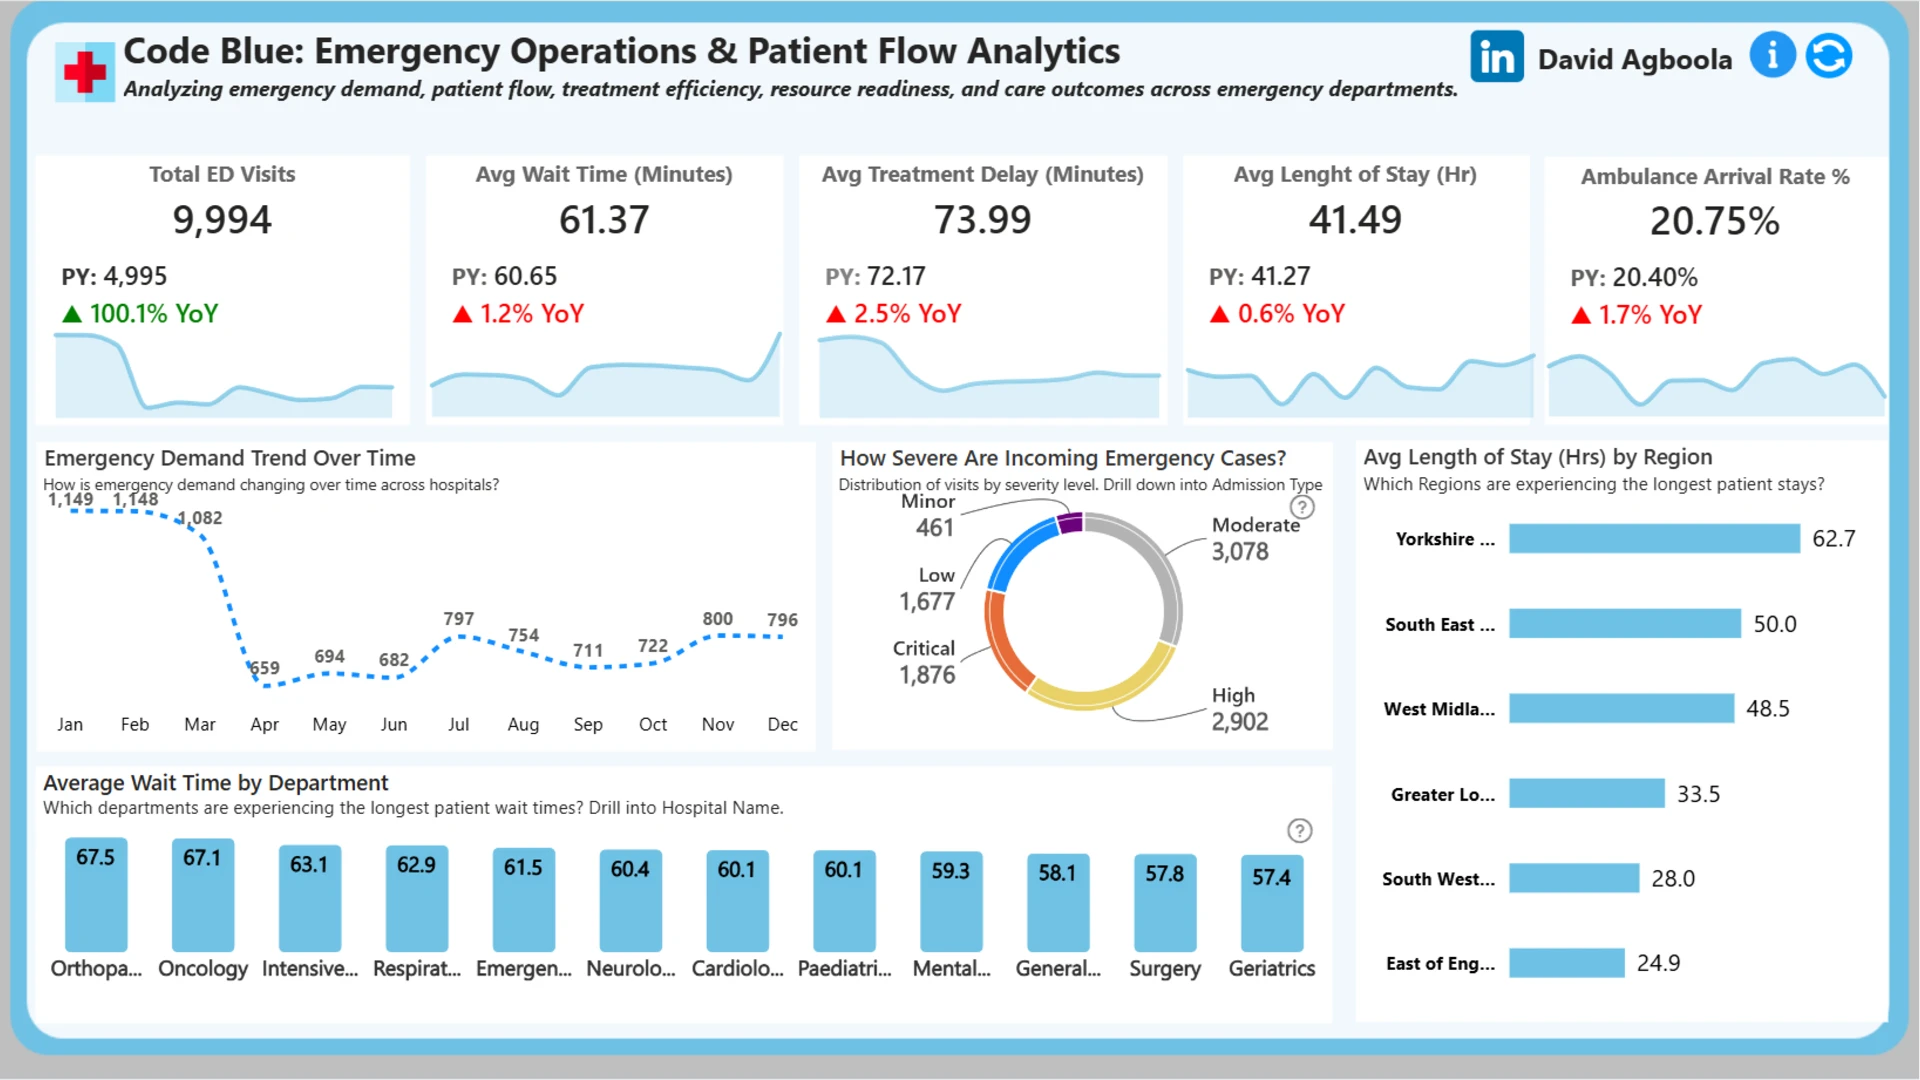
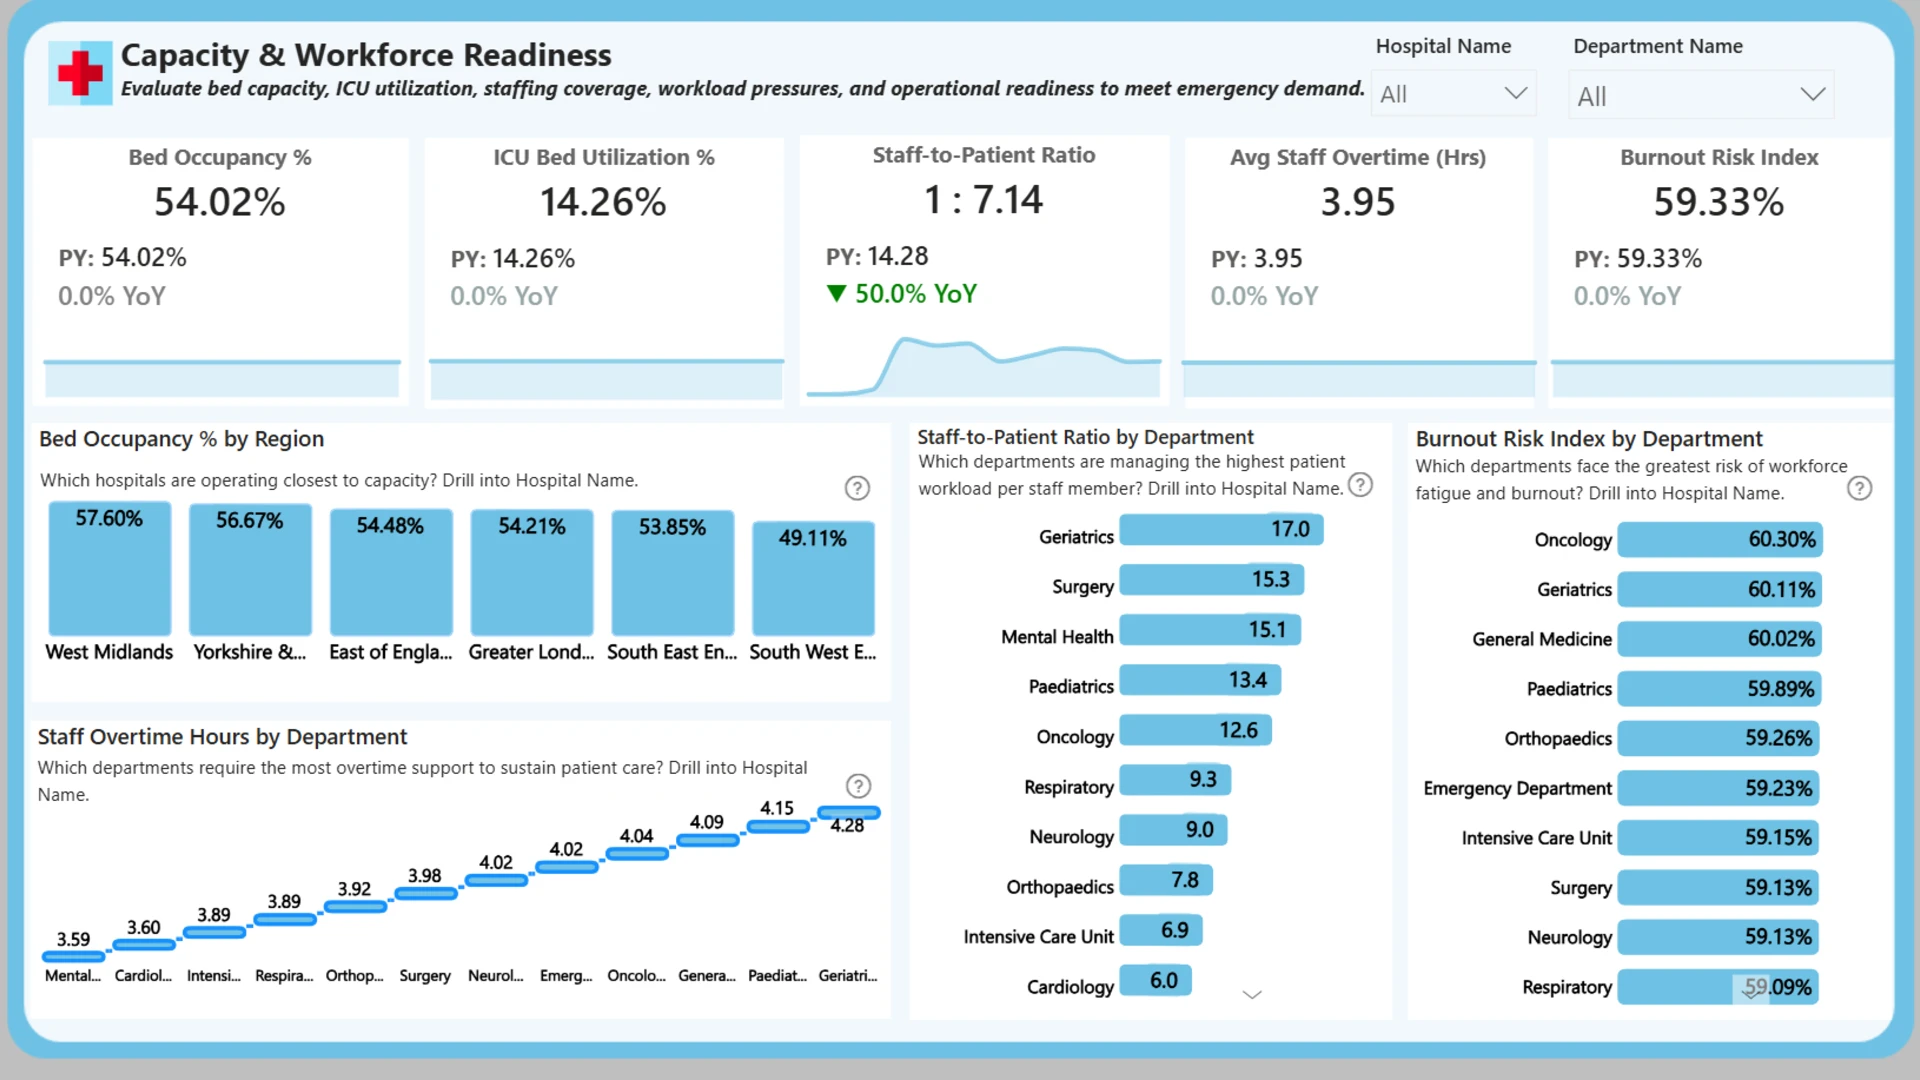
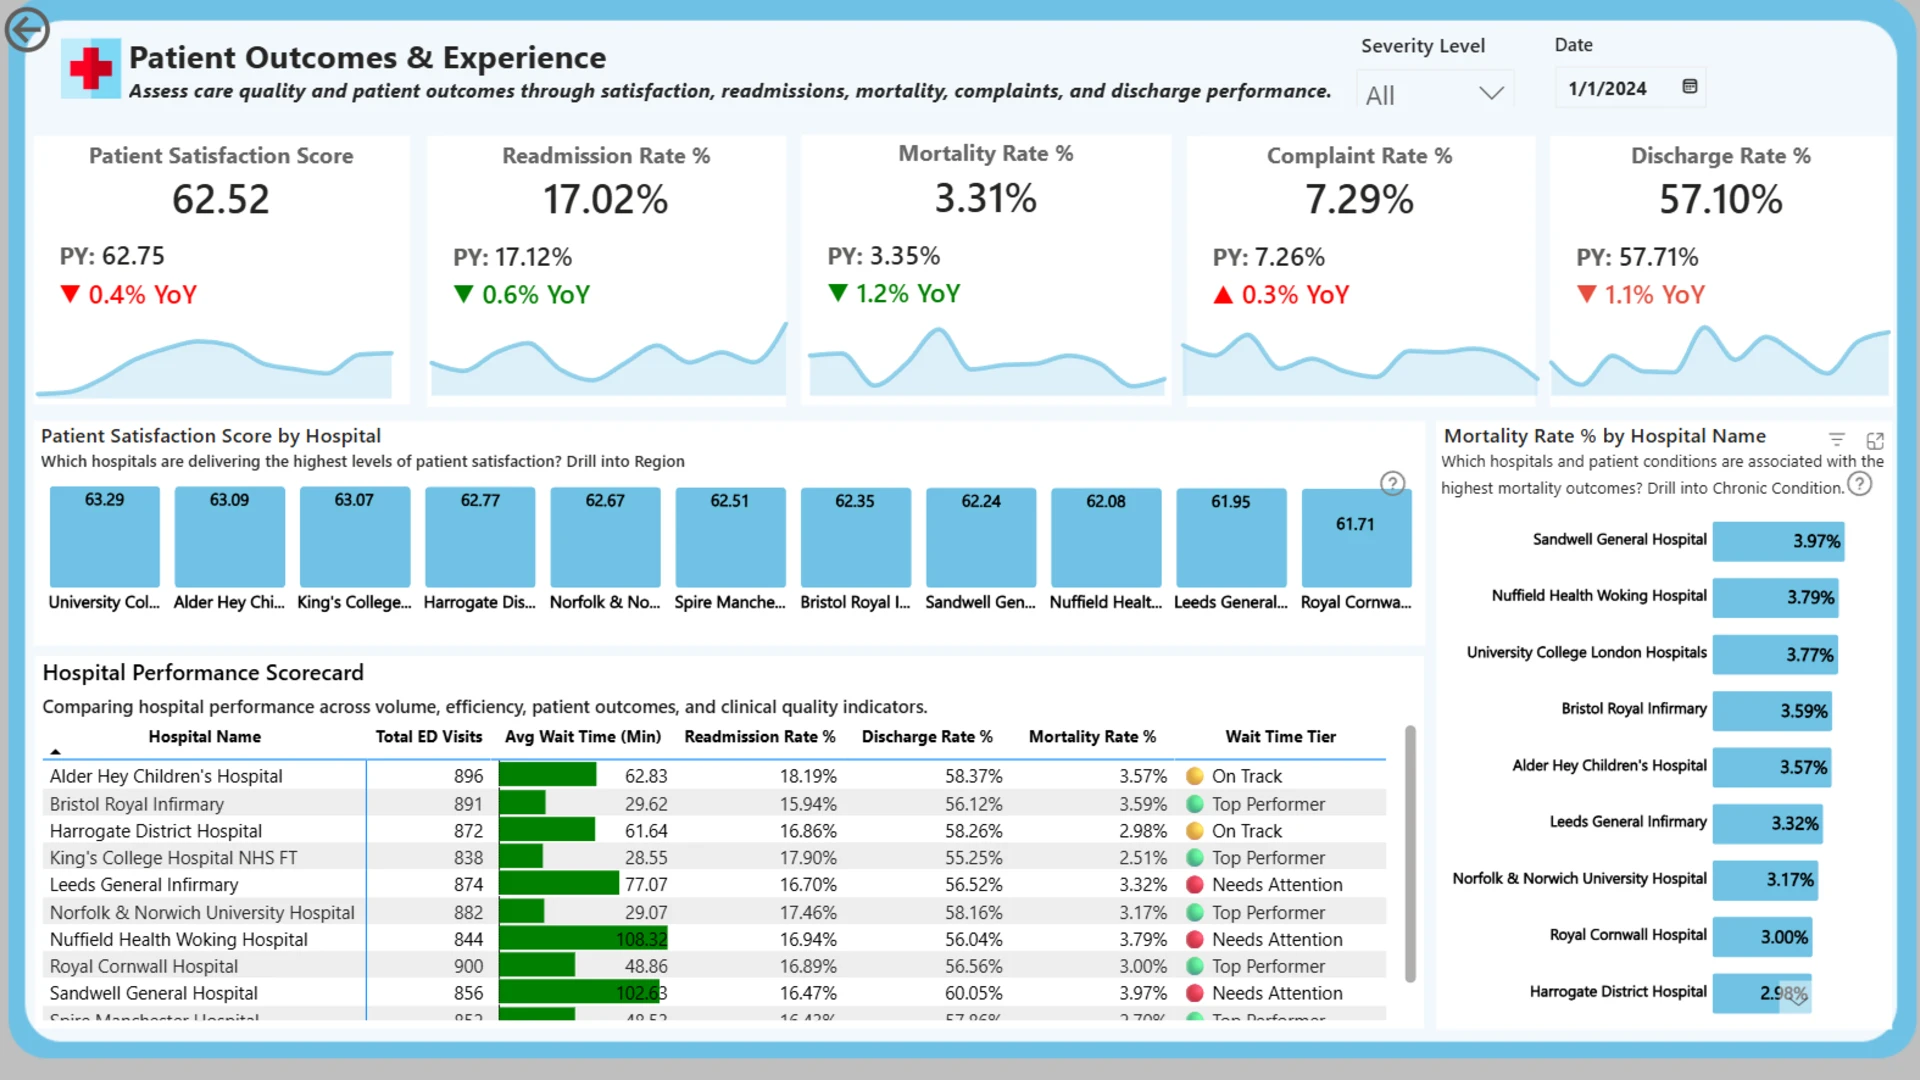
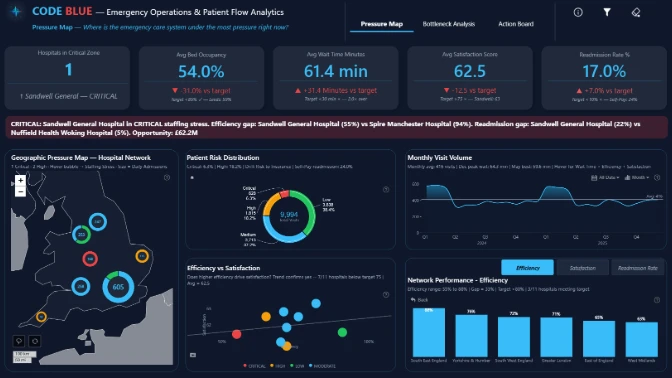
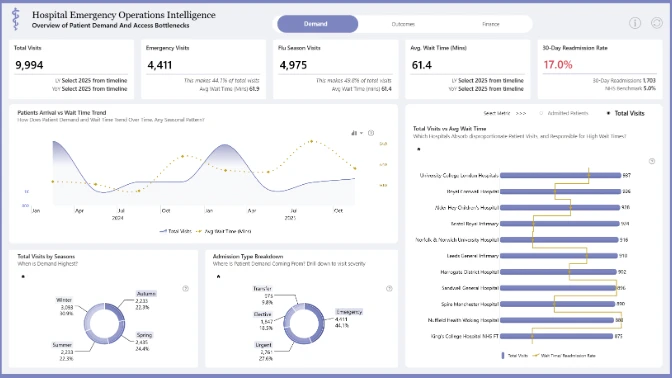
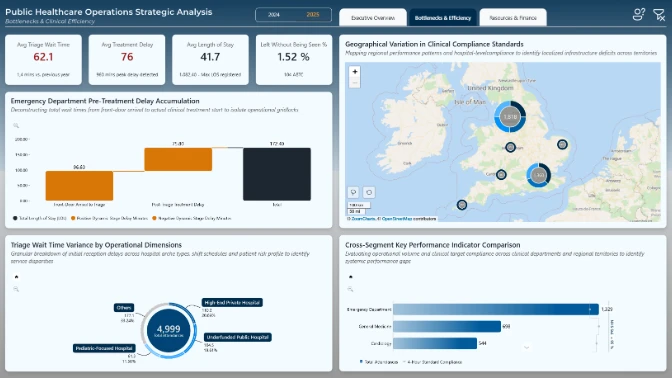
This interactive Power BI report explores the Code Blue Emergency Operations & Patient Flow dataset. It analyzes hospital performance, patient flow, bed capacity, emergency operations, pressure points, risks, inefficiencies, and outcome factors across hospitals and key healthcare segments.
Submitted to the FP20 Analytics ZoomCharts Data Challenge 38: Emergency Operations & Patient Flow Analytics, using native Power BI visuals and ZoomCharts Drill Down PRO custom visuals.
Author’s Description:
This report analyzes emergency department operations across multiple hospitals to uncover opportunities for improving patient flow, workforce efficiency, and clinical outcomes. It reveals significant variation in waiting times, length of stay, staffing pressure, and patient outcomes, highlighting how operational performance differs across hospitals and regions. Interactive scorecards and performance analysis help identify both high-performing facilities and areas requiring intervention. The findings support data-driven decisions that improve resource allocation, reduce delays, strengthen workforce planning, and enhance the overall quality of emergency care.
ZoomCharts visuals used




4U Report Challenges
Participate in data challenges, build and submit reports to get free template downloads.
Join CommunityMobile view allows you to interact with the report. To Download the template please switch to desktop view.
How to use a PBIX template
Preview the interactive report, download the PBIX file, open it in Power BI Desktop, and replace the same data connection with your own dataset.
Preview and download
Explore the report online and download the PBIX template file.
Open in Power BI Desktop
Open the downloaded PBIX file in Power BI Desktop.
Connect your data
Replace the sample data source with your own dataset.
Refresh and adjust
Refresh the model and update fields or visual were needed.
Save and share
Save your report and publish it for your audience.


