1141
Paralympics Analysis Dileep B
Paralympics Analysis Dileep B
More Report pages
Report Author: Dileep Venkata Prasad Bocha
1141
Share template with others
Report submitted for Onyx Data DataDNA ZoomCharts Mini Challenge, September 2024. The report was built based on Paralympic Games dataset and includes ZoomCharts custom Drill Down PRO visuals for Power BI.
Author's description:
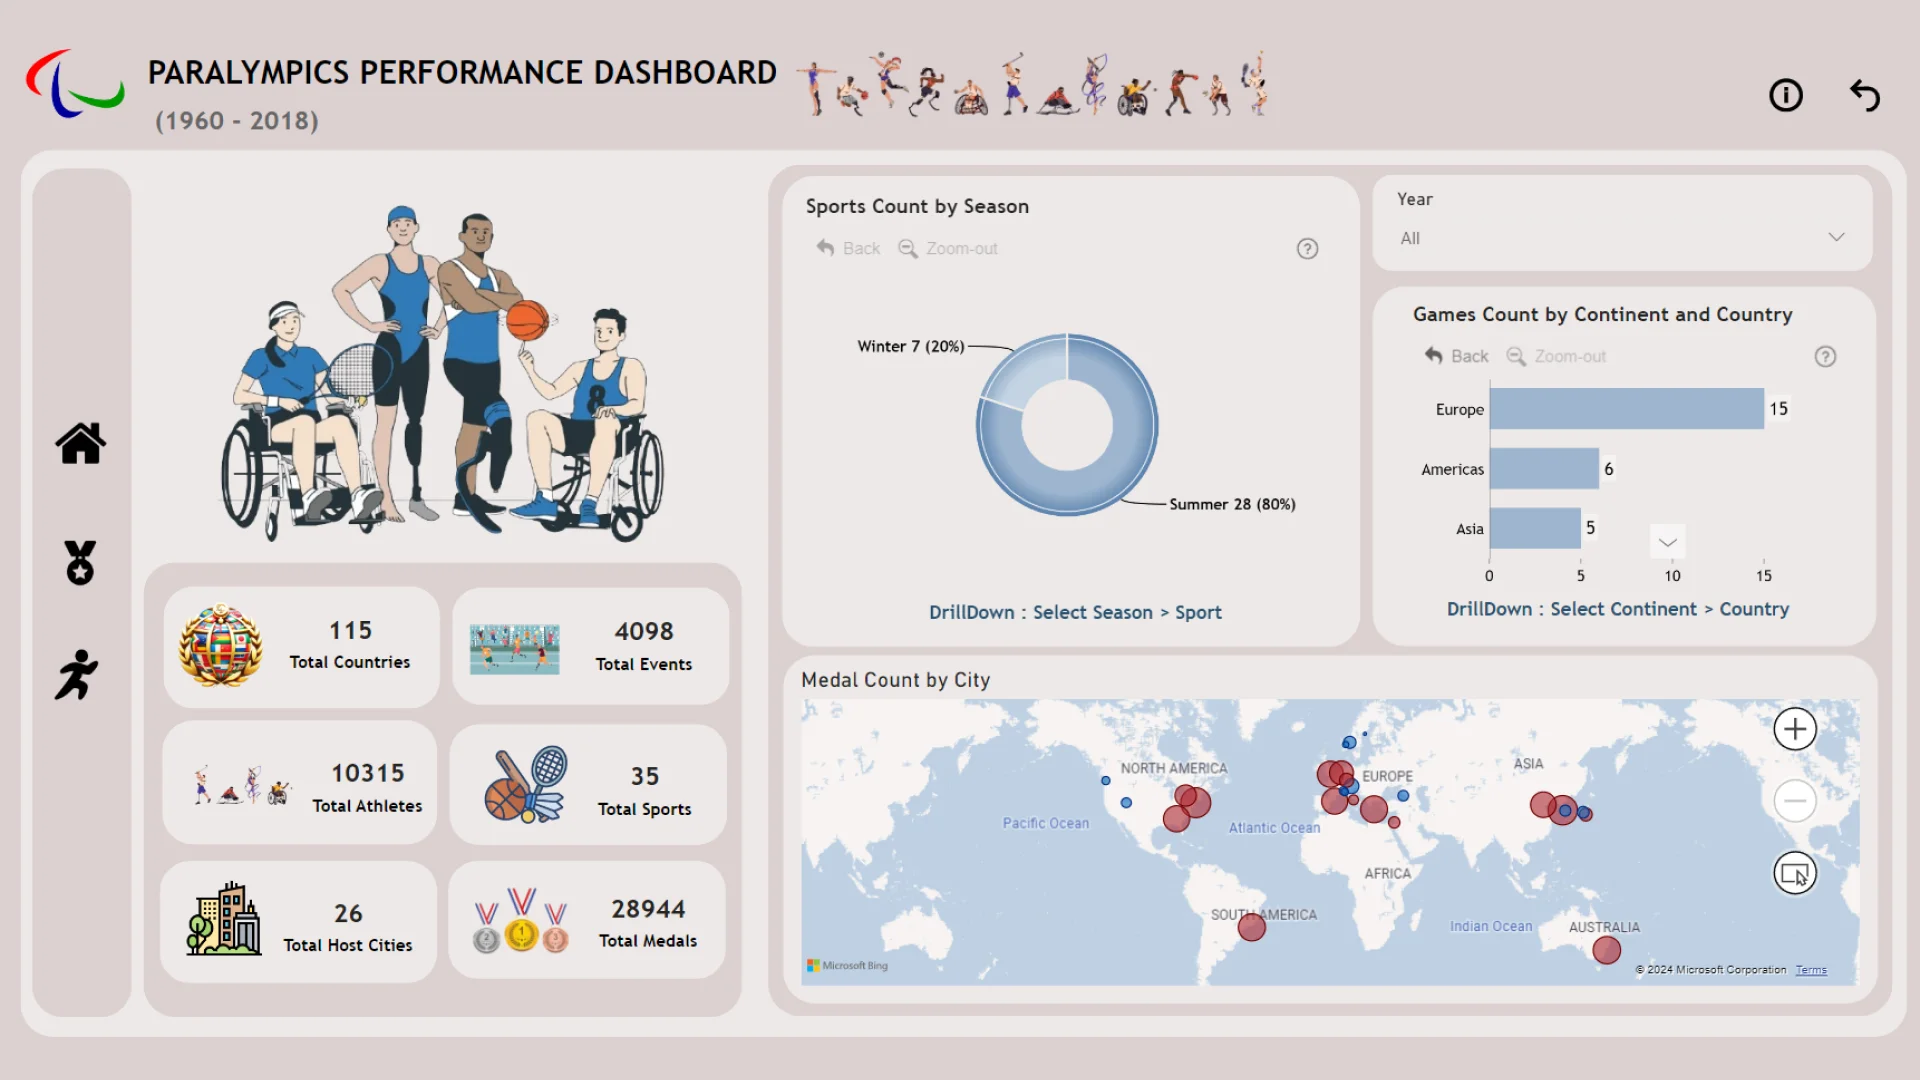
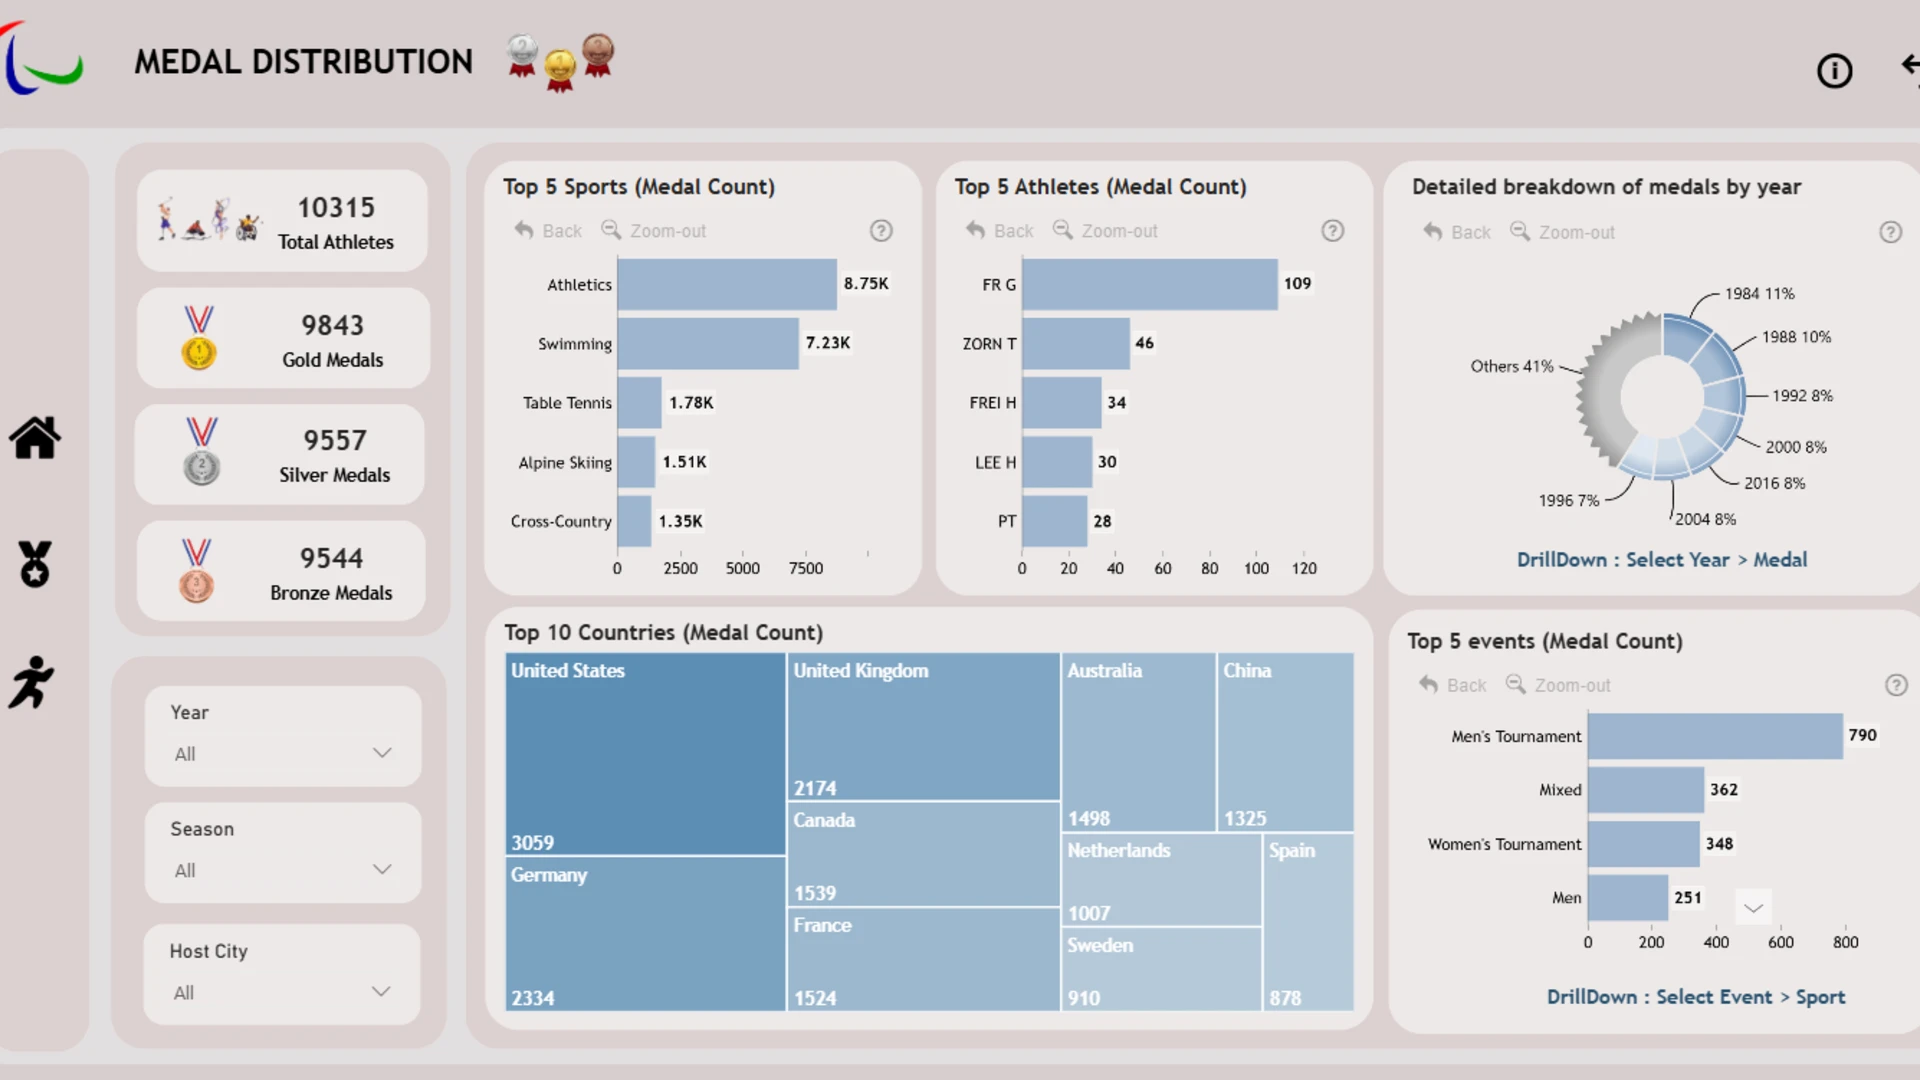
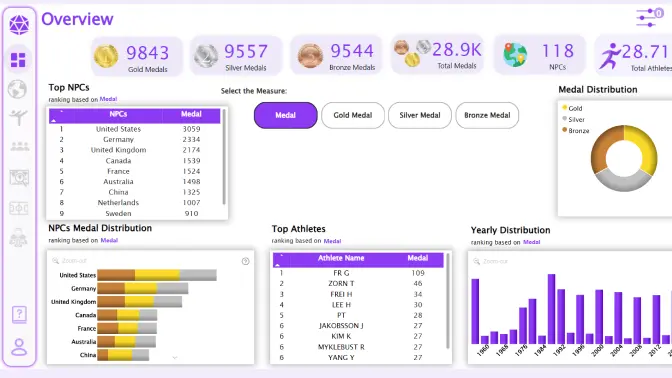
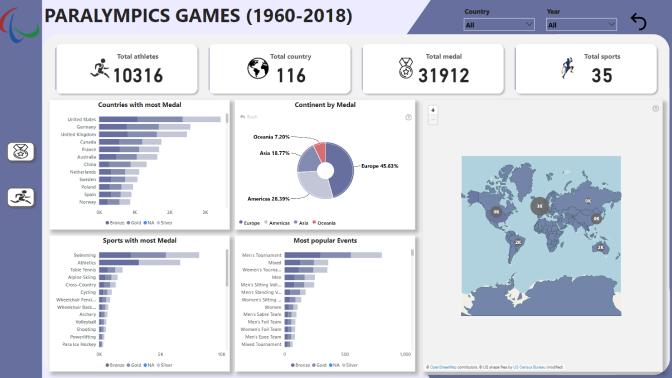
Medal Distribution Analysis: Visualizes medal counts by country, sport, and athlete performance, highlighting top performers and event trends.
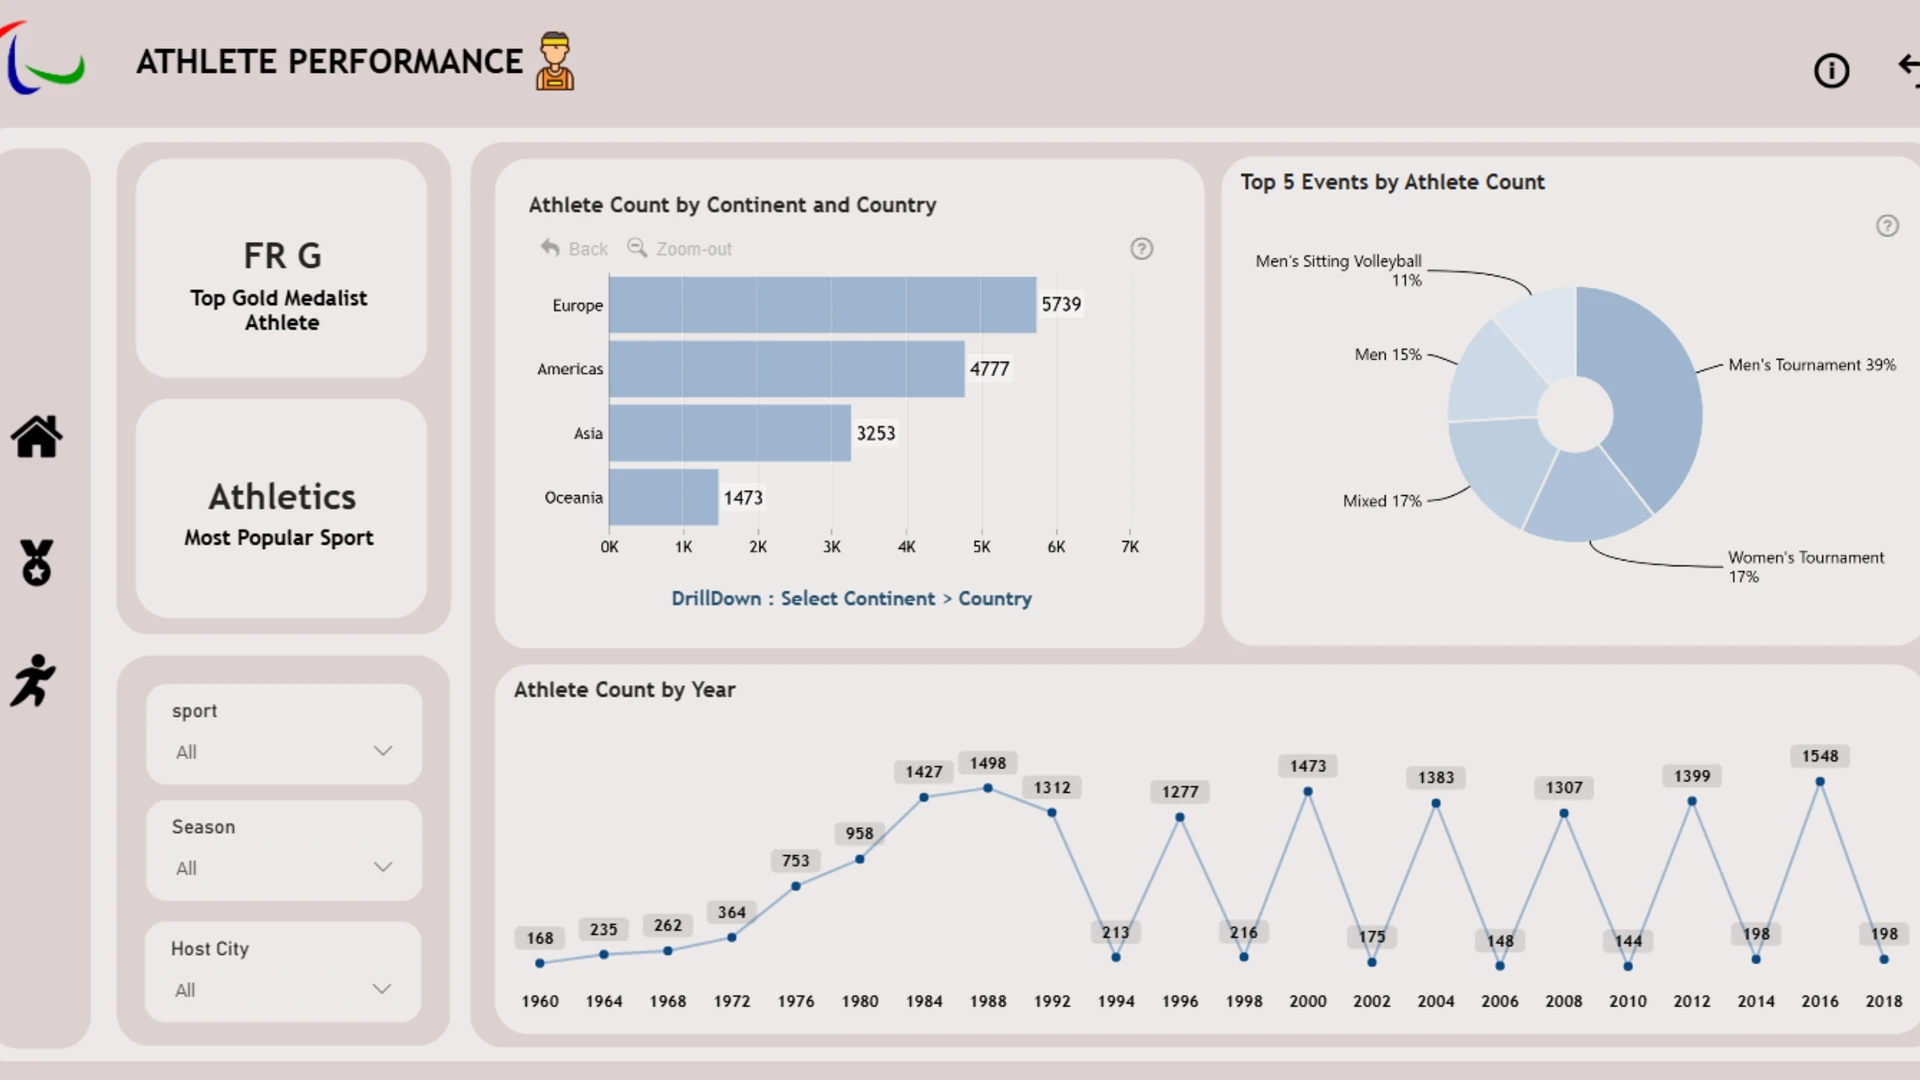
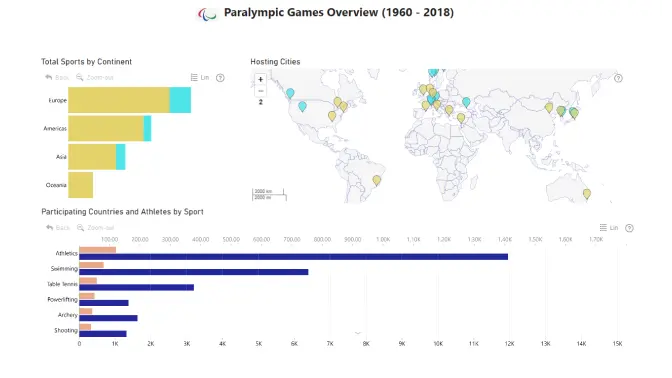
Athlete Performance Insights: Tracks athlete participation over the years, showing continent, country, and event breakdowns to understand global contributions.
Trend and Growth Visualization: Yearly insights into athlete counts and medal distribution, revealing the evolution of the Paralympic Games over time.
Interactive Drilldowns: Users can explore data by year, sport, or region, offering a deeper dive into specific trends and performance metrics.
4U Report Challenges
Participate in data challenges, build and submit reports to get free template downloads.
Join CommunityMobile view allows you to interact with the report. To Download the template please switch to desktop view.
Was this helpful? Thank you for your feedback!
Sorry about that.
How can we improve it?