1241
Paralympic Analysis
Paralympic Analysis
More Report pages
Report Author: Sweety Antoni David
1241
Share template with others
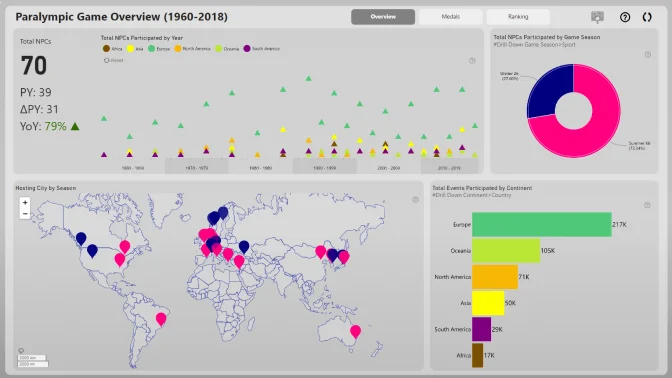
Report submitted for Onyx Data DataDNA ZoomCharts Mini Challenge, September 2024. The report was built based on Paralympic Games dataset and includes ZoomCharts custom Drill Down PRO visuals for Power BI.
Author's description:
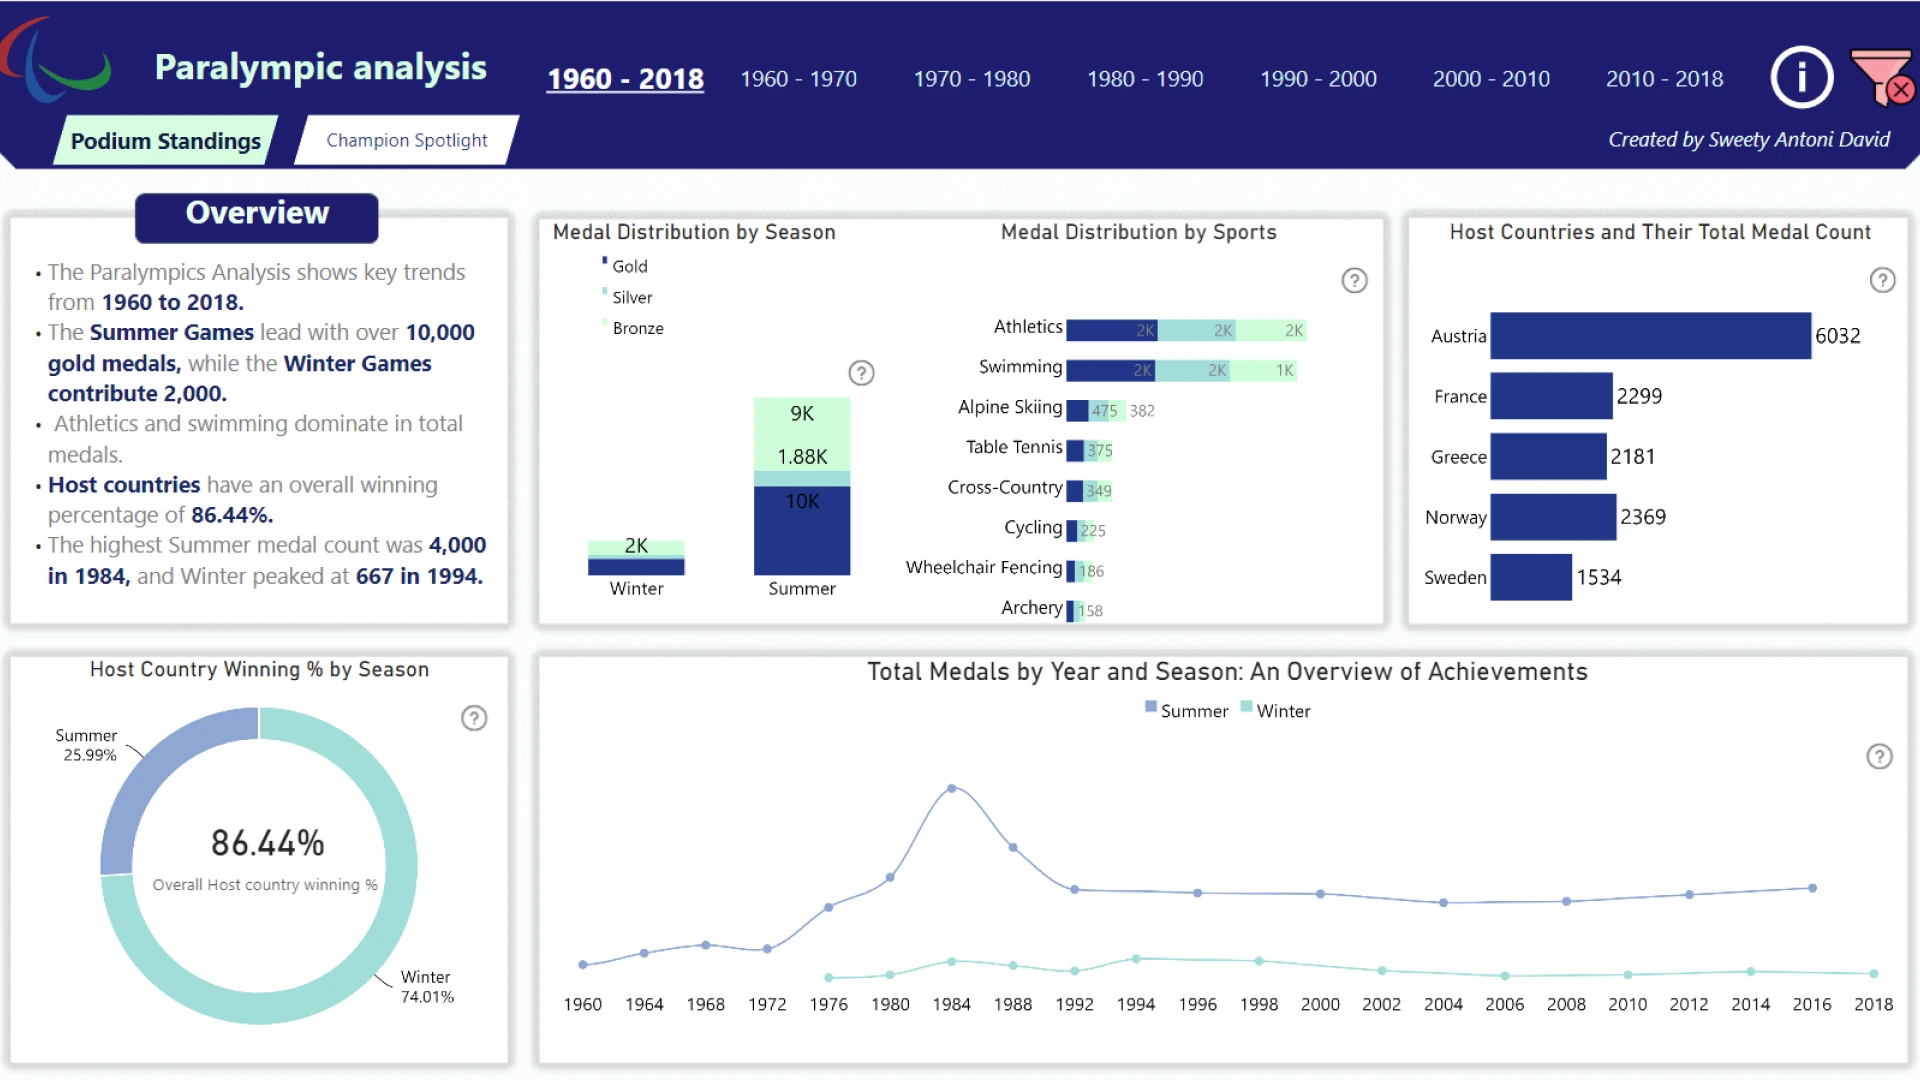
The Paralympics and Olympics Analysis (1960-2018) highlights key trends in medal distribution and participation. In the Paralympics, the Summer Games dominated with over 10,000 gold medals, while the Winter Games contributed 2,000. Athletics and swimming were the most awarded sports, and host countries enjoyed an impressive winning percentage of 86.44%.
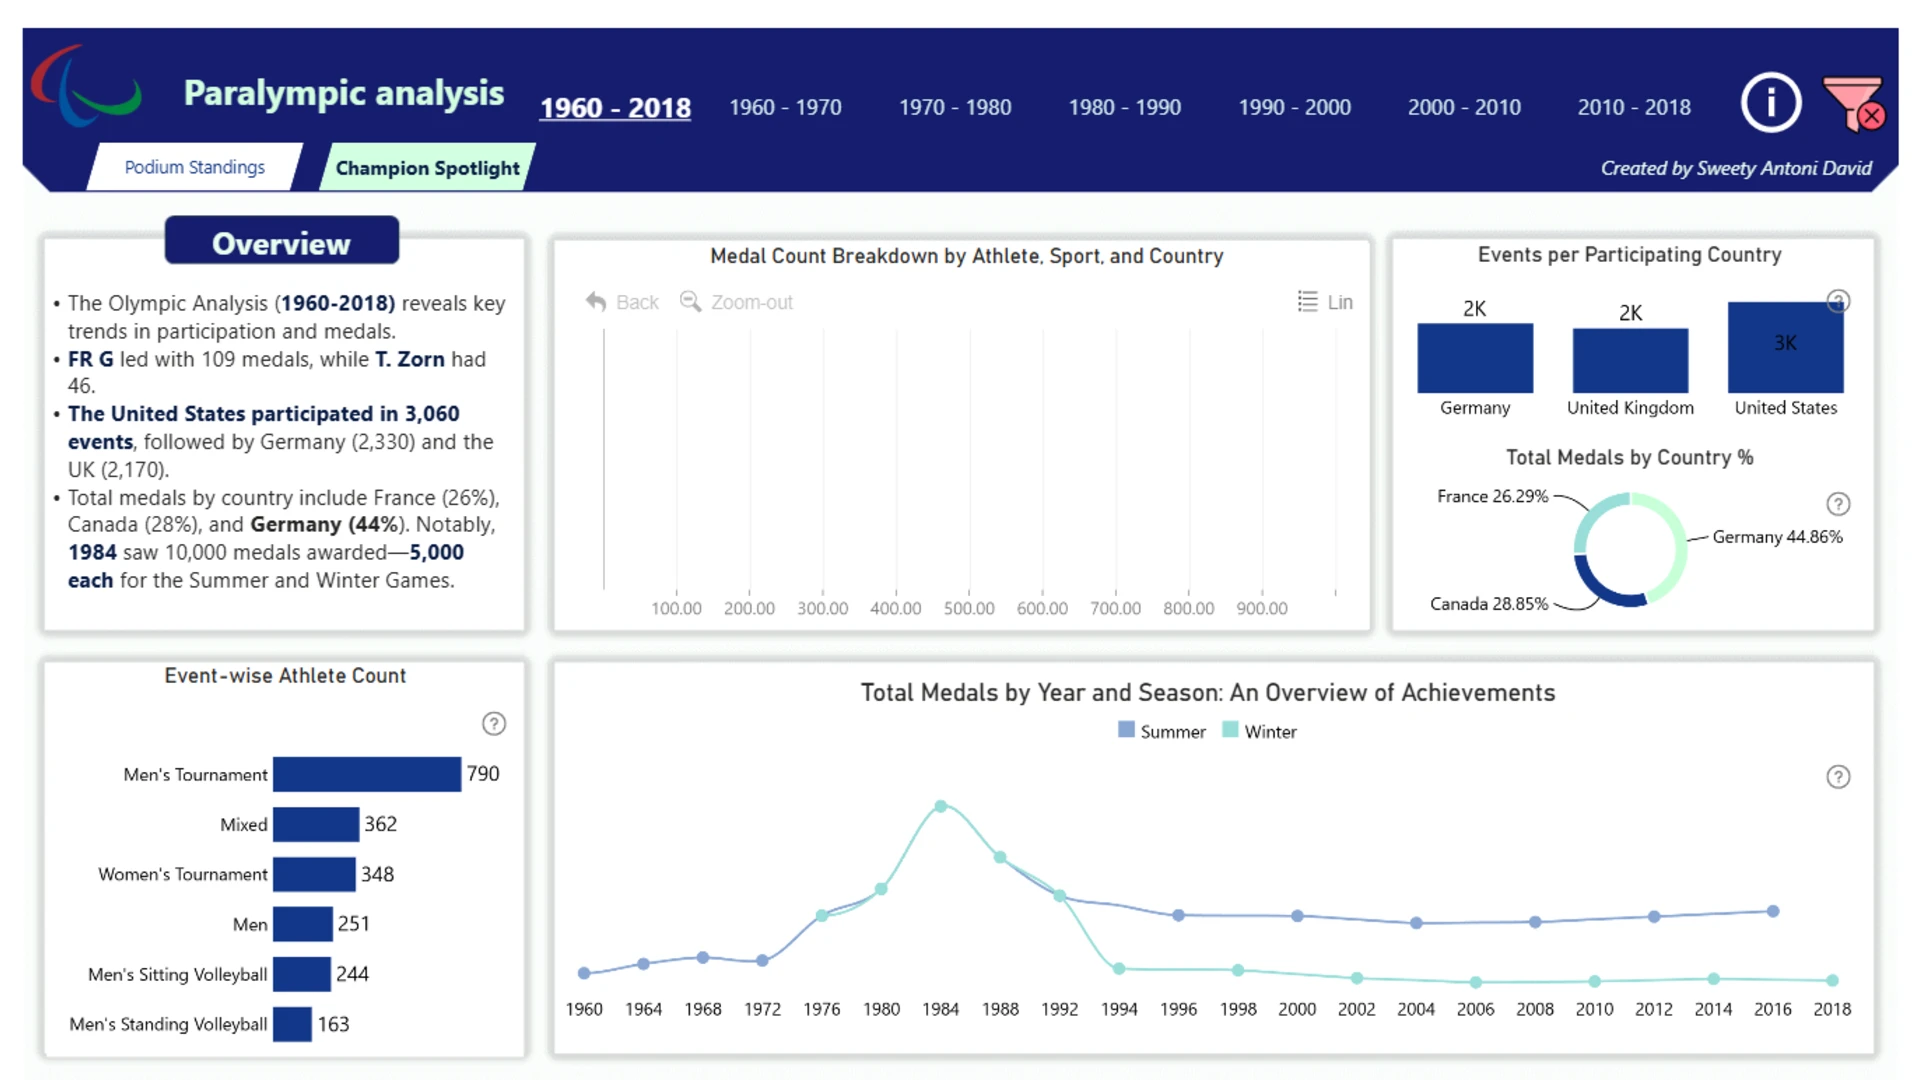
The peak Summer medal count was 4,000 in 1984, while Winter peaked at 667 in 1994. In the Olympics, FR Germany led with 109 medals, and athlete T. Zorn earned 46. The United States participated in the most events (3,060), followed by Germany (2,330) and the UK (2,170).
Notable medal percentages by country include France (26%), Canada (28%), and Germany (44%). In 1984, 10,000 medals were awarded across both Summer and Winter Games.



4U Report Challenges
Participate in data challenges, build and submit reports to get free template downloads.
Join CommunityMobile view allows you to interact with the report. To Download the template please switch to desktop view.
How to use a PBIX template
Preview the interactive report, download the PBIX file, open it in Power BI Desktop, and replace the same data connection with your own dataset.
Preview and download
Explore the report online and download the PBIX template file.
Open in Power BI Desktop
Open the downloaded PBIX file in Power BI Desktop.
Connect your data
Replace the sample data source with your own dataset.
Refresh and adjust
Refresh the model and update fields or visual were needed.
Save and share
Save your report and publish it for your audience.


