715
Operations Analytics Report for an Animal Shelter 2
Operations Analytics Report for an Animal Shelter 2
More Report pages
Report Author: Iyabo Sindiku
715
Share template with others
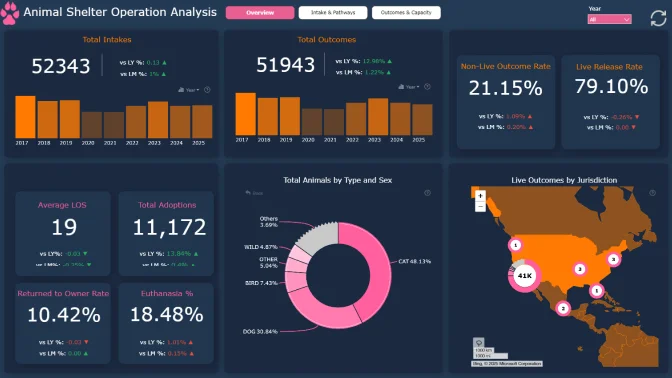
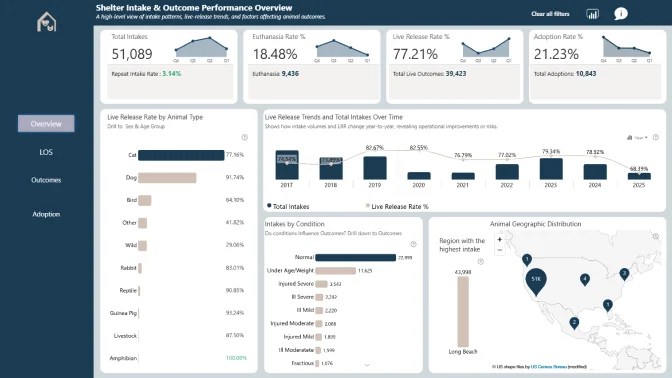
This Power BI report uses the Animal Shelter Operations dataset from a the City of Long Beach Animal Care Services, US. The report features ZoomCharts Drill Down PRO custom visuals for Power BI. It was submitted to the Onyx Data DataDNA ZoomCharts Mini Challenge in December 2025.
Author's Description:
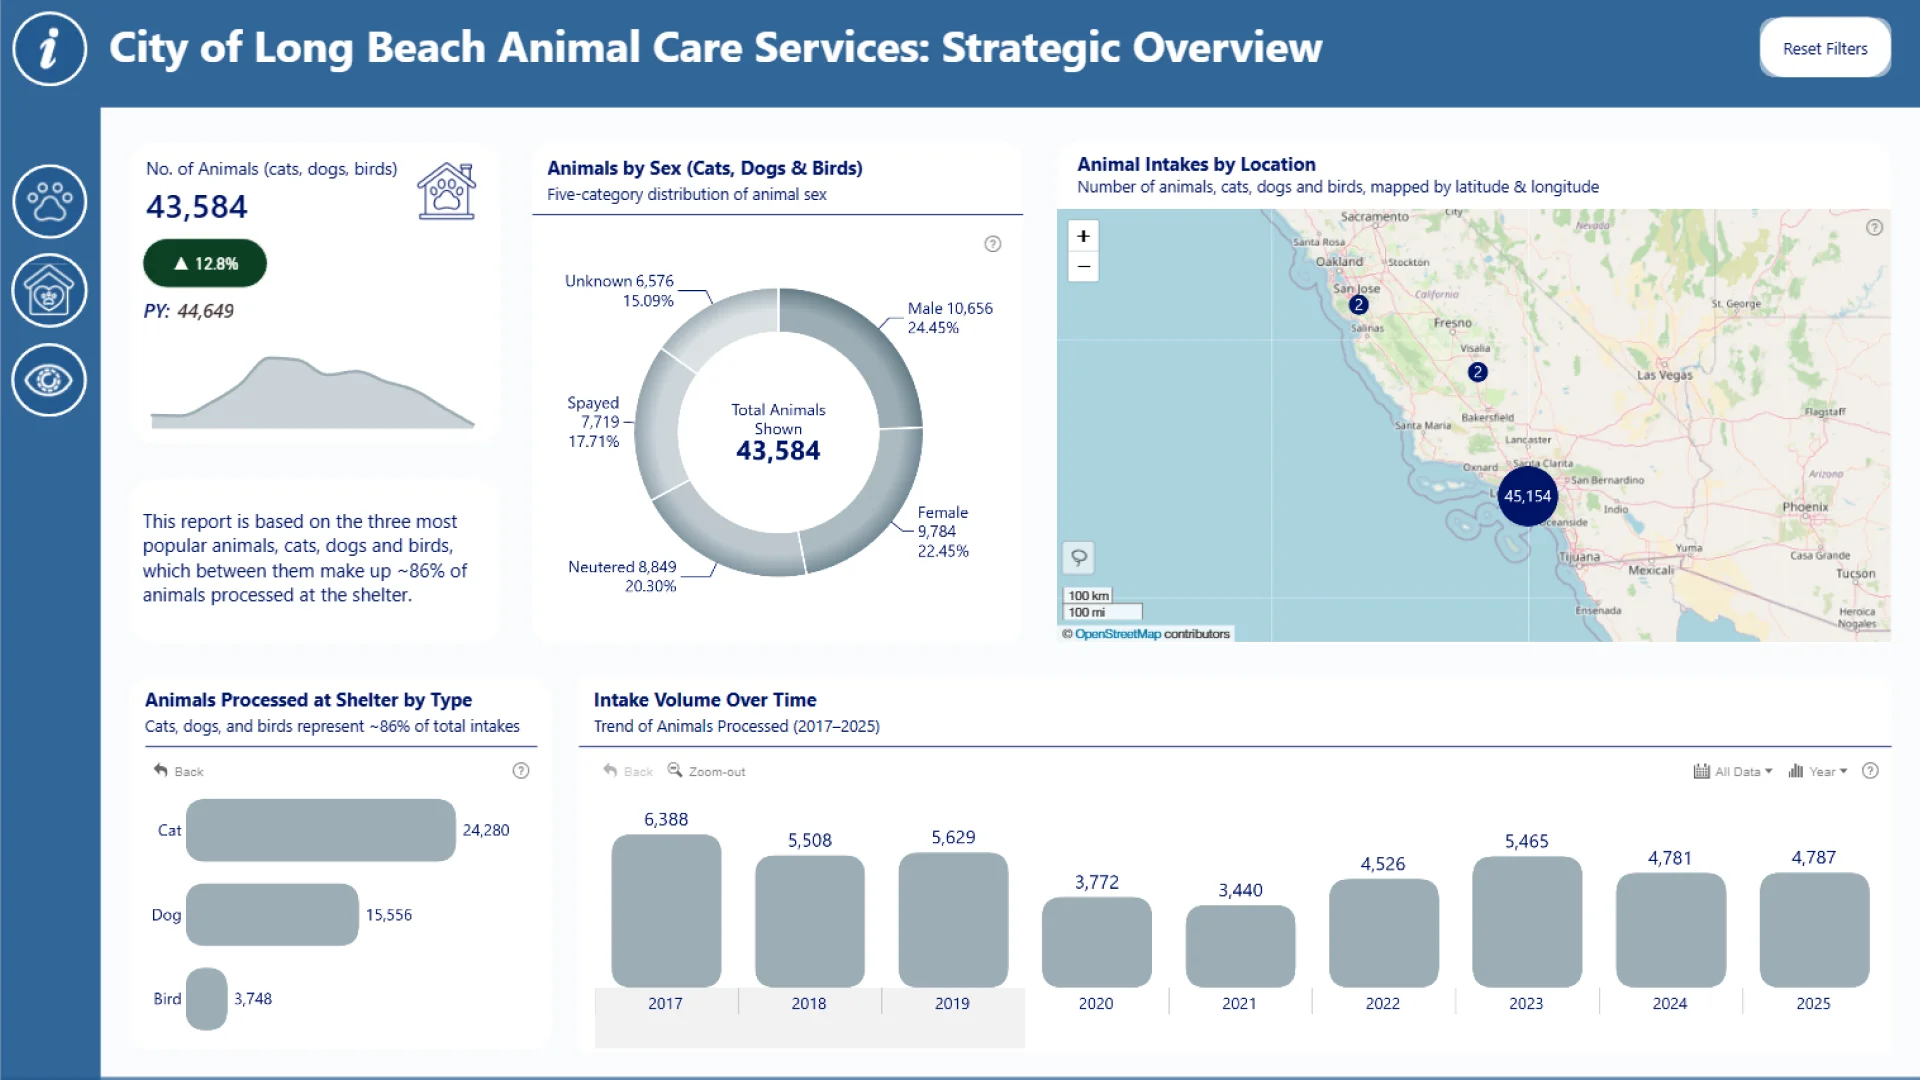
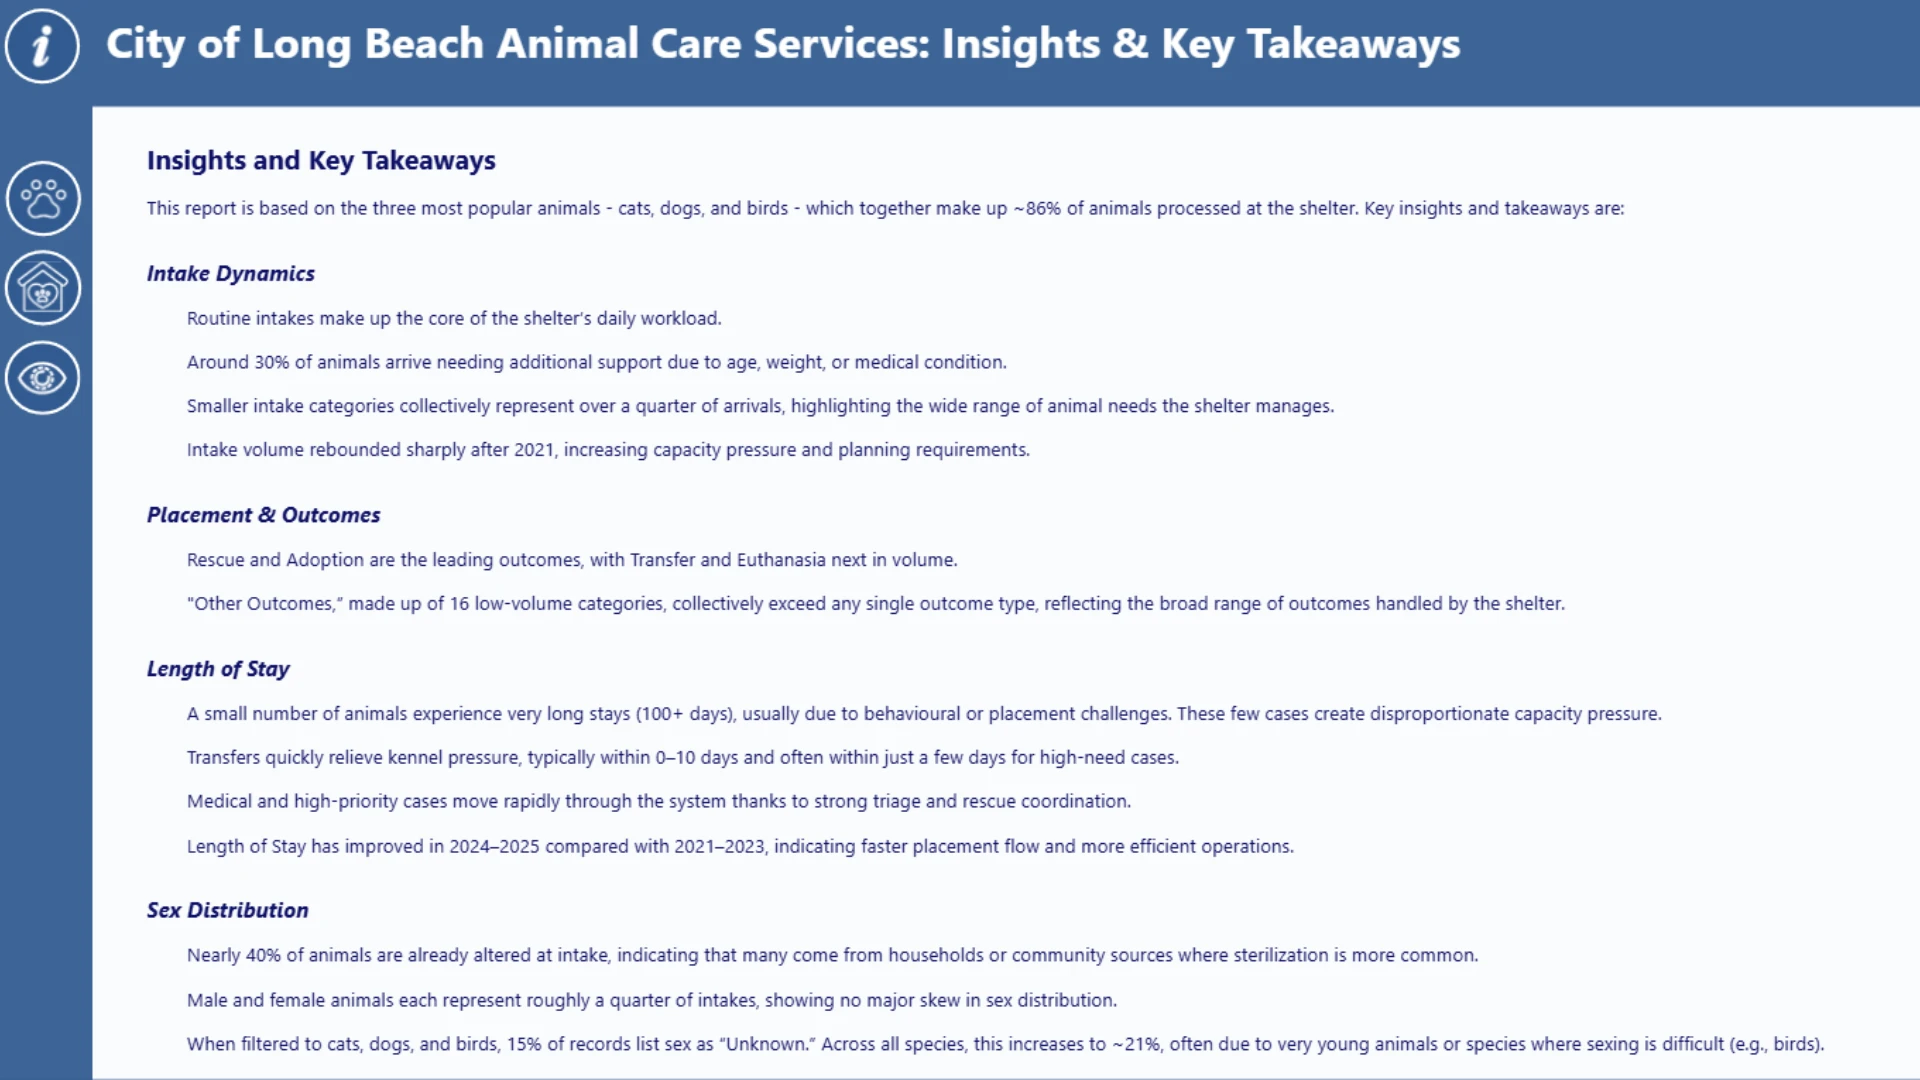
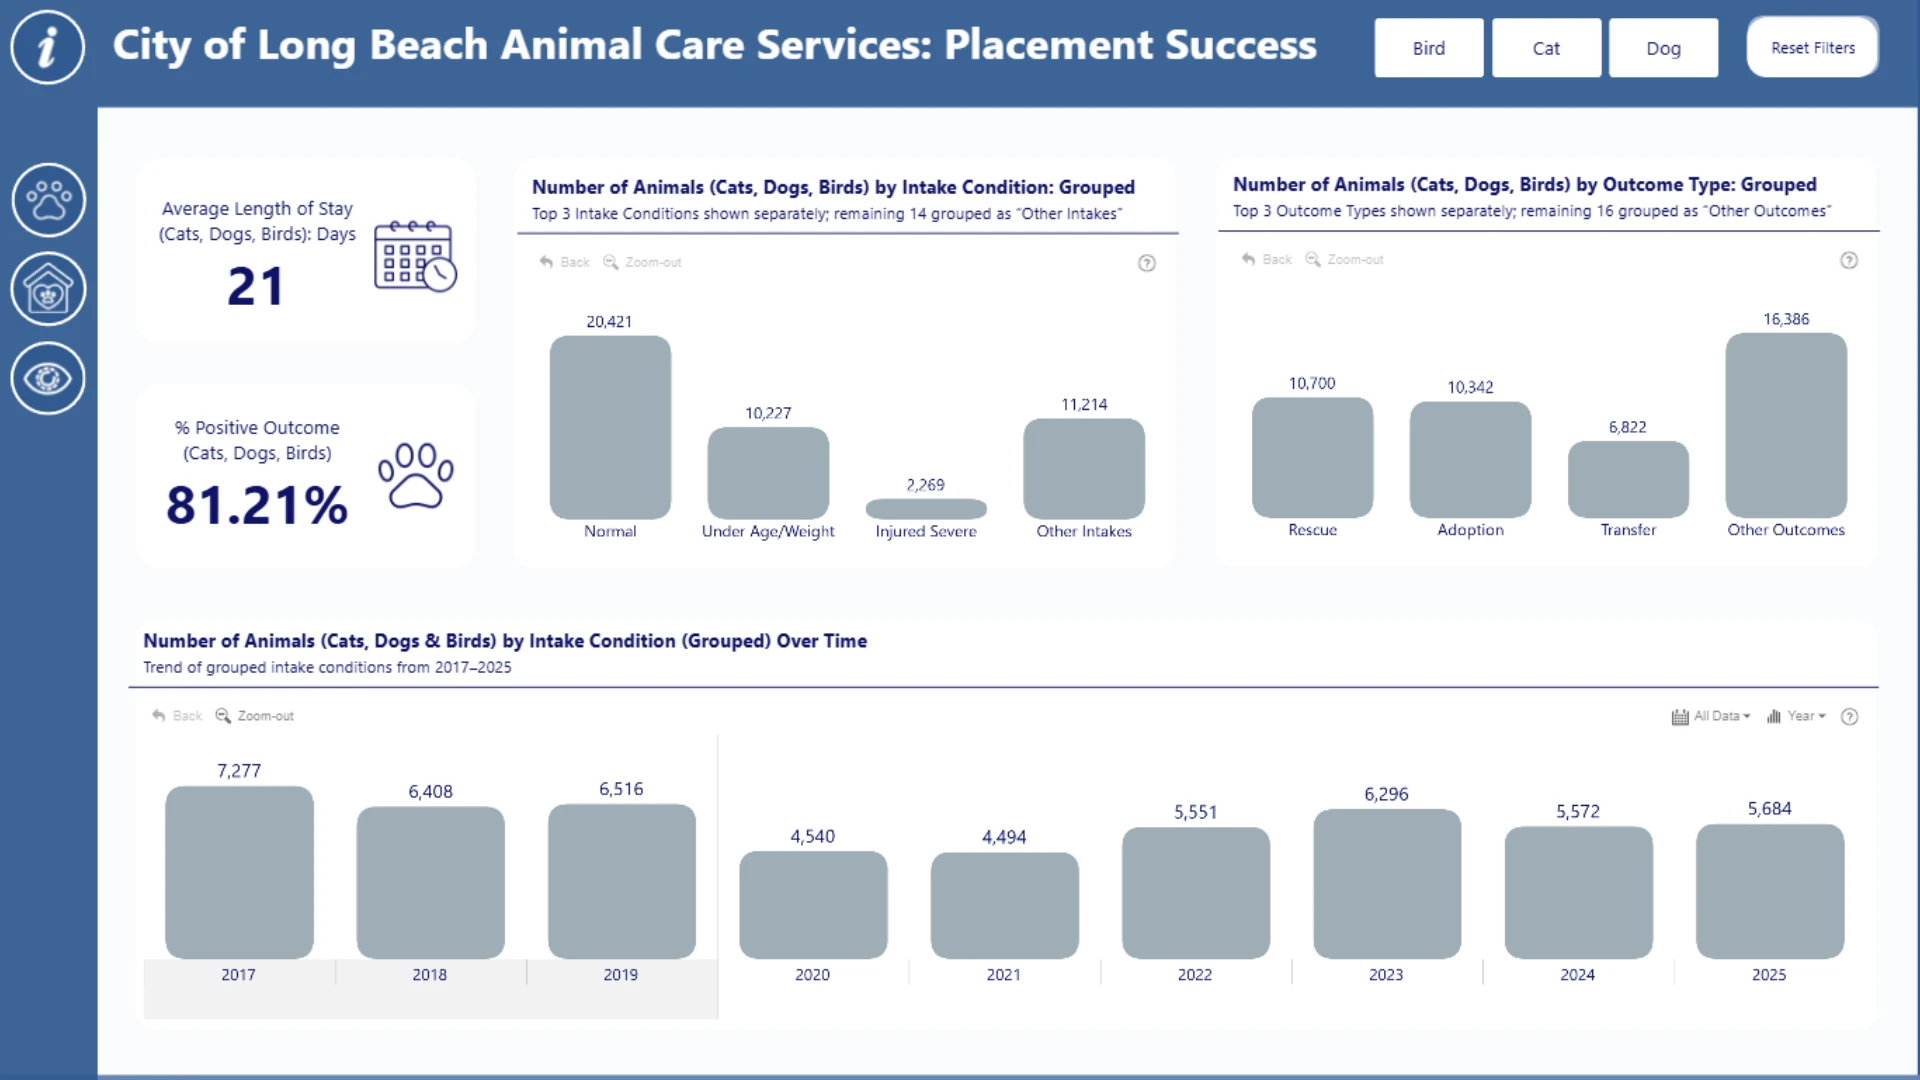
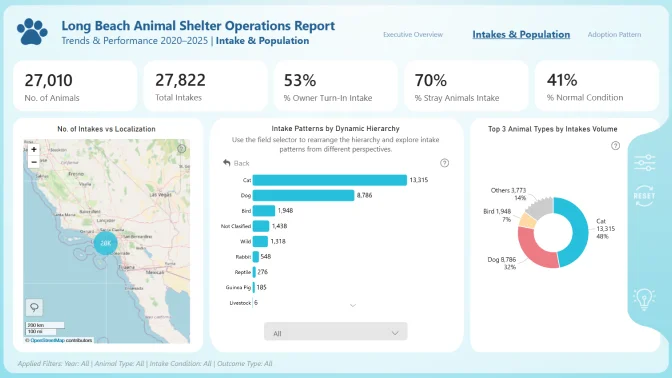
This report examines animal intake and outcome patterns at Long Beach Animal Care Services. Routine intakes make up most shelter activity, though nearly one-third of animals require additional care due to age, weight, or medical needs. Intake volume increased sharply after 2021, placing greater strain on shelter capacity. Adoption and rescue are the primary outcomes, while smaller outcome categories collectively represent a meaningful share of exits. Most animals move through the system quickly, but a small number experience extended stays (100+ days), creating disproportionate resource demands. Sex distribution is roughly balanced, with a notable share of records listing sex as unknown.
ZoomCharts visuals used
4U Report Challenges
Participate in data challenges, build and submit reports to get free template downloads.
Join CommunityMobile view allows you to interact with the report. To Download the template please switch to desktop view.
Was this helpful? Thank you for your feedback!
Sorry about that.
How can we improve it?