689
Onyx Oct Challenge
Onyx Oct Challenge
Report Author: Tamera Okafor
689
Share template with others
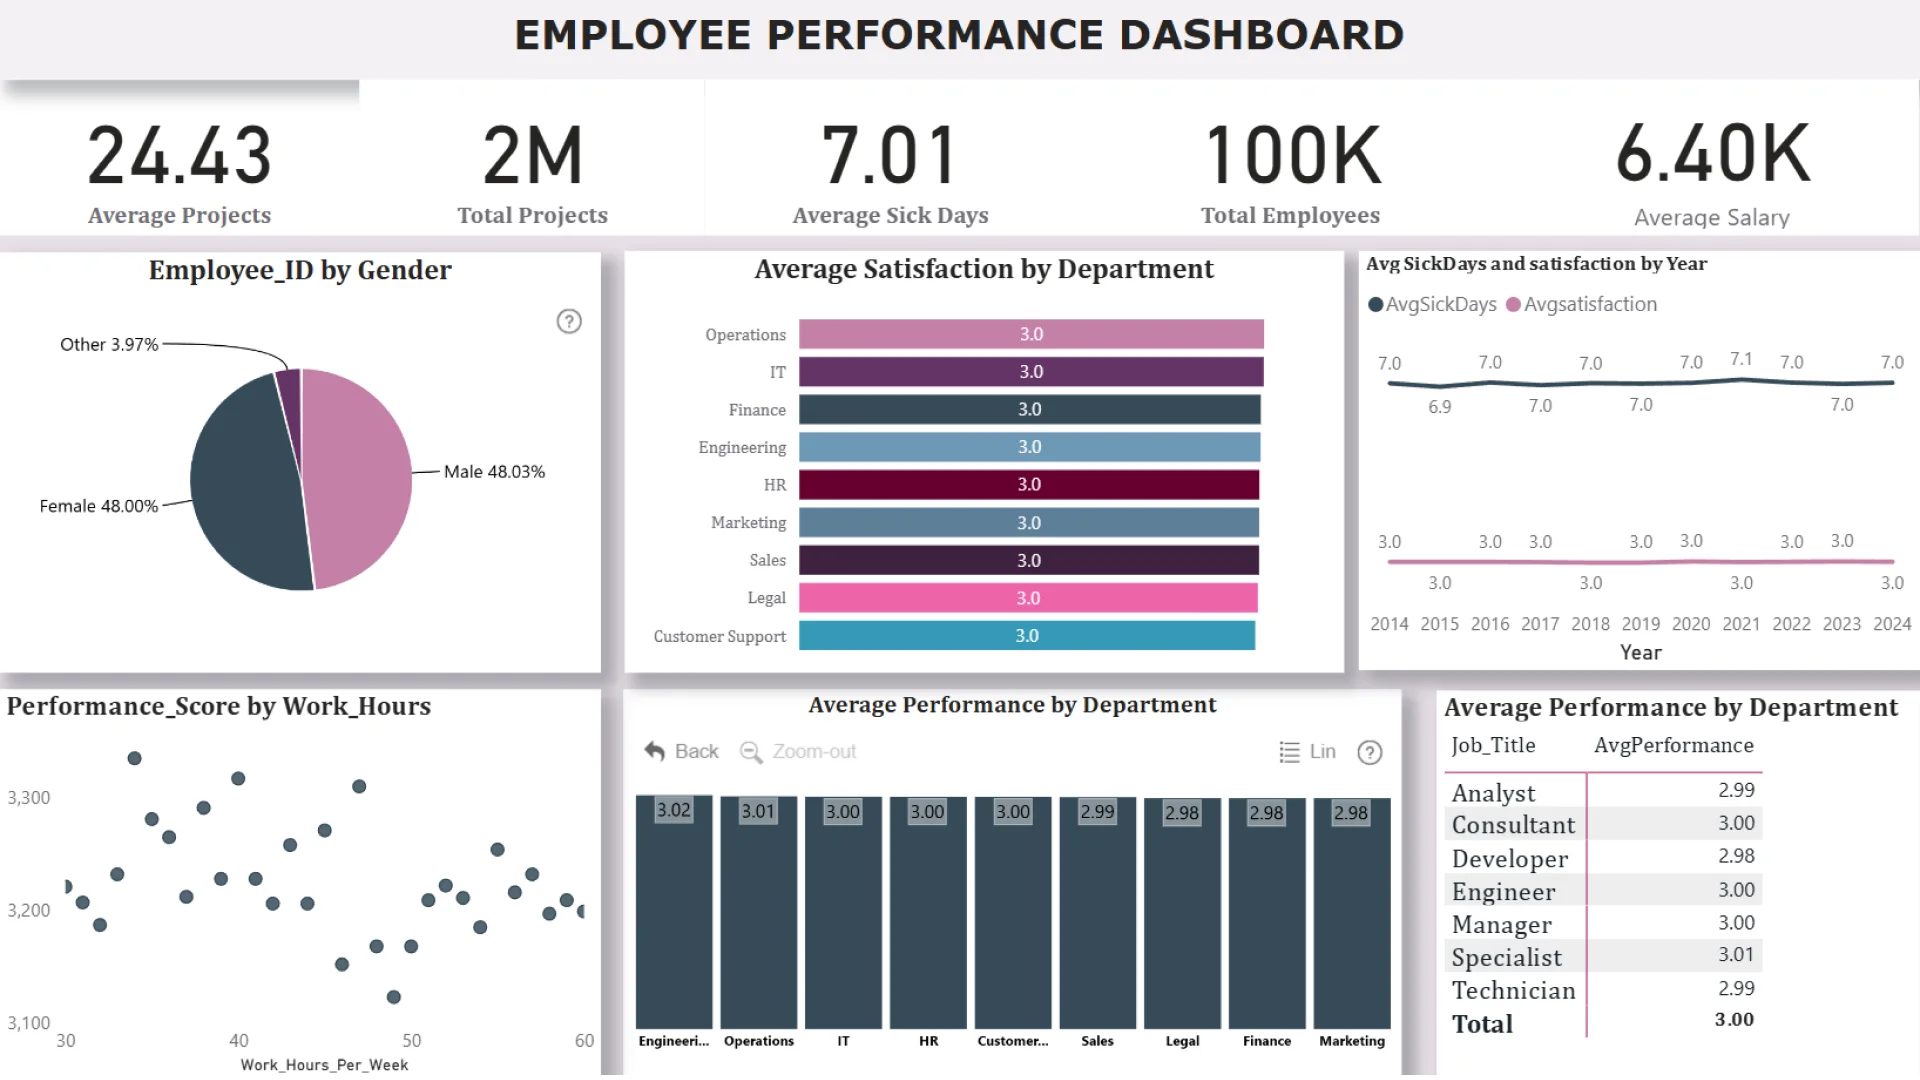
Report submitted for Onyx Data DataDNA ZoomCharts Mini Challenge, October 2024. The report was built based on Employee Performance dataset and includes ZoomCharts custom Drill Down PRO visuals for Power BI.
Author's description:
The visuals is a brief analysis of the employee performance. The key trends highlighted are in the area of Performance, productivity metrics, job satisfaction trends, demographic and compensation analysis.
4U Report Challenges
Participate in data challenges, build and submit reports to get free template downloads.
Join CommunityMobile view allows you to interact with the report. To Download the template please switch to desktop view.

Was this helpful? Thank you for your feedback!
Sorry about that.
How can we improve it?