877
ONYX Data - Udemy Sales Overview
ONYX Data - Udemy Sales Overview
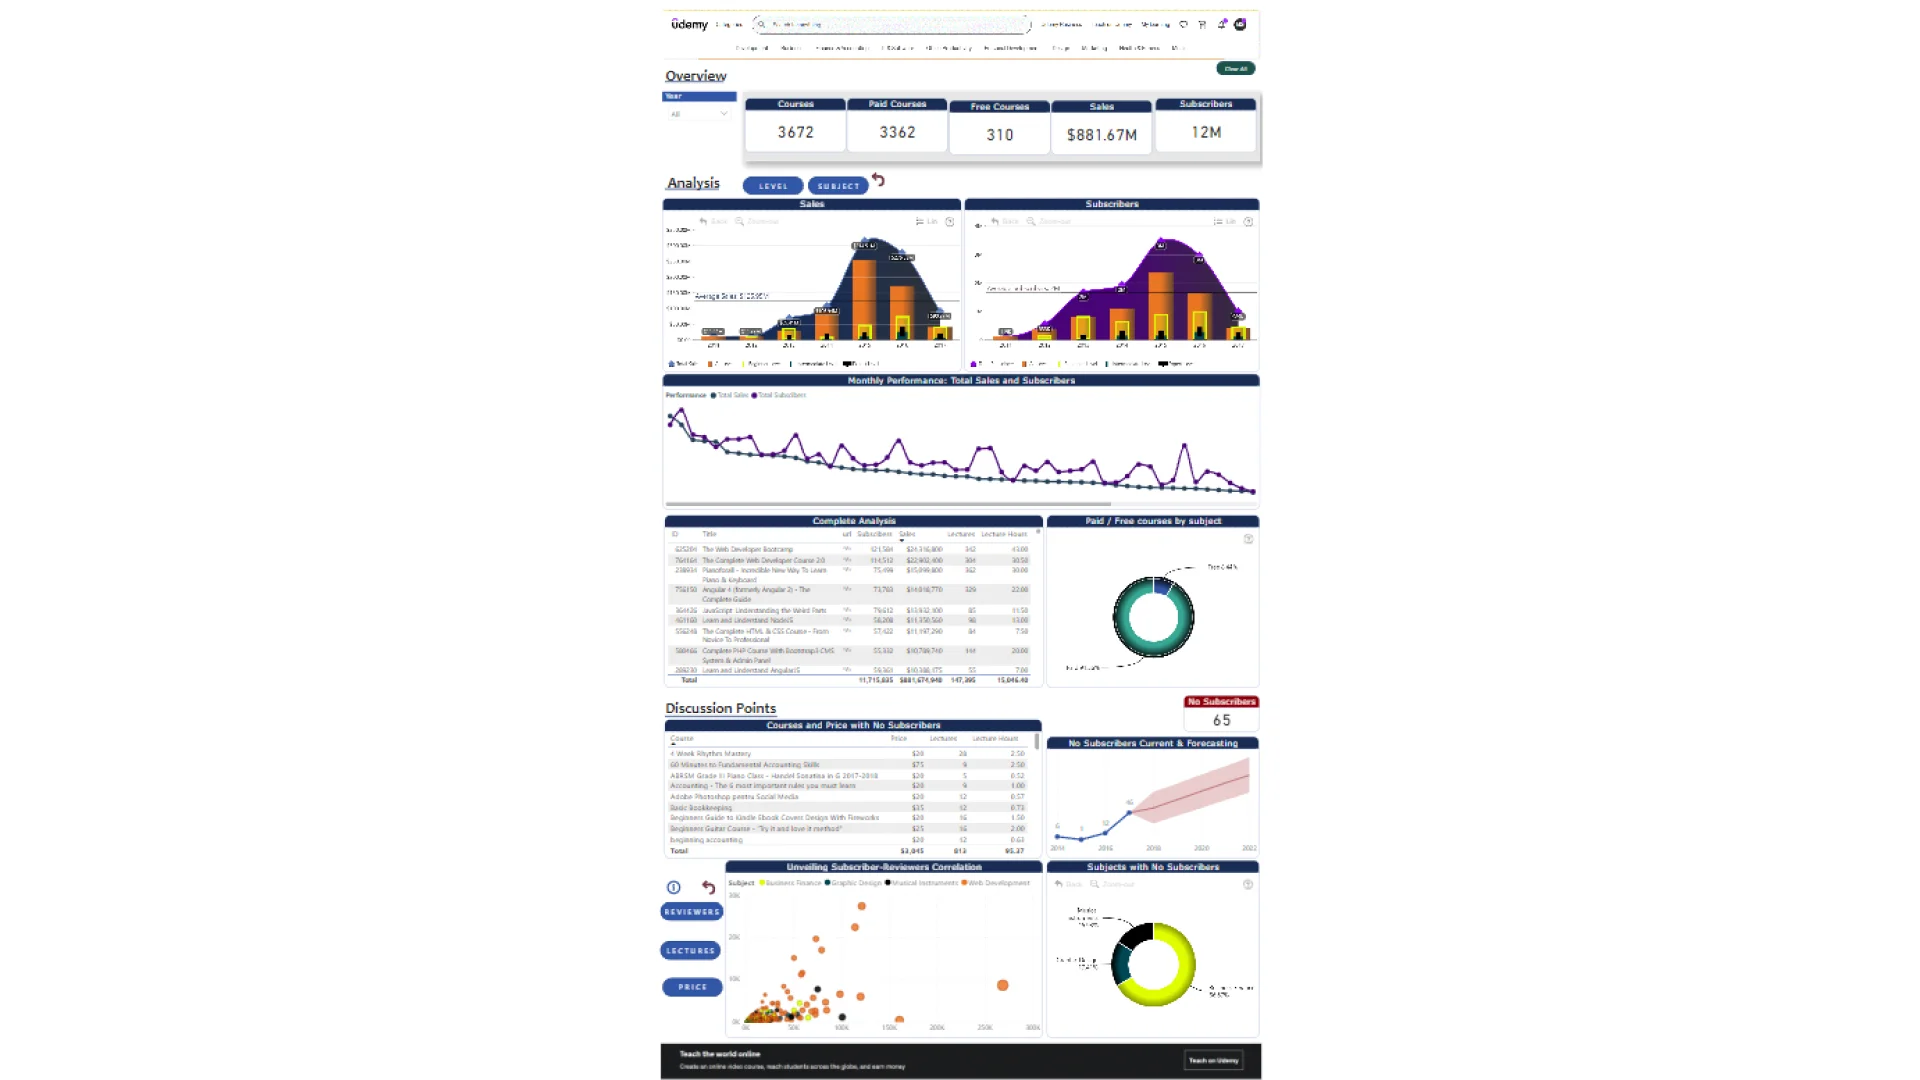
Report Author: Bimal Subhasis
877
Share template with others
Report submitted for Onyx Data DataDNA ZoomCharts Mini Challenge, January 2024. The report was built based on Udemy Courses dataset and includes ZoomCharts custom Drill Down PRO visuals for Power BI.
Author's description:
The report is divided into three main sections for easy navigation and understanding:
A. Header Search: This section is mapped to the landing page of Udemy.
1. Overall Performance: In this section, card visuals are used to provide an overview of the overall performance. It gives a snapshot of key indicators and metrics.
2. Analysis: This section offers an in-depth analysis of sales and subscriptions by year. It includes hyperlinks for investigating performance at different levels and subjects. A reset button is available to return to the default view. Additionally, monthly performance can be examined based on user selection. A detailed tabular view of courses is provided, along with segregation between paid and free types, along with their respective subjects.
3. Correlation and Discussion Points: In this section, several discussion points are covered, including courses with no subscribers, current and future forecasts, and correlations between subscribers and each component. Buttons are available to change the visuals based on the existing selection, and a reset button is provided to return to the default view. Overall, this report offers a comprehensive and organized view of the data, allowing users to analyze performance and explore correlations effectively.



4U Report Challenges
Participate in data challenges, build and submit reports to get free template downloads.
Join CommunityMobile view allows you to interact with the report. To Download the template please switch to desktop view.
How to use a PBIX template
Preview the interactive report, download the PBIX file, open it in Power BI Desktop, and replace the same data connection with your own dataset.
Preview and download
Explore the report online and download the PBIX template file.
Open in Power BI Desktop
Open the downloaded PBIX file in Power BI Desktop.
Connect your data
Replace the sample data source with your own dataset.
Refresh and adjust
Refresh the model and update fields or visual were needed.
Save and share
Save your report and publish it for your audience.


