966
Onyx Data October 2024 Challenge 2
Onyx Data October 2024 Challenge 2
More Report pages
Report Author: Md Mizanur Rahman Nayan
966
Share template with others
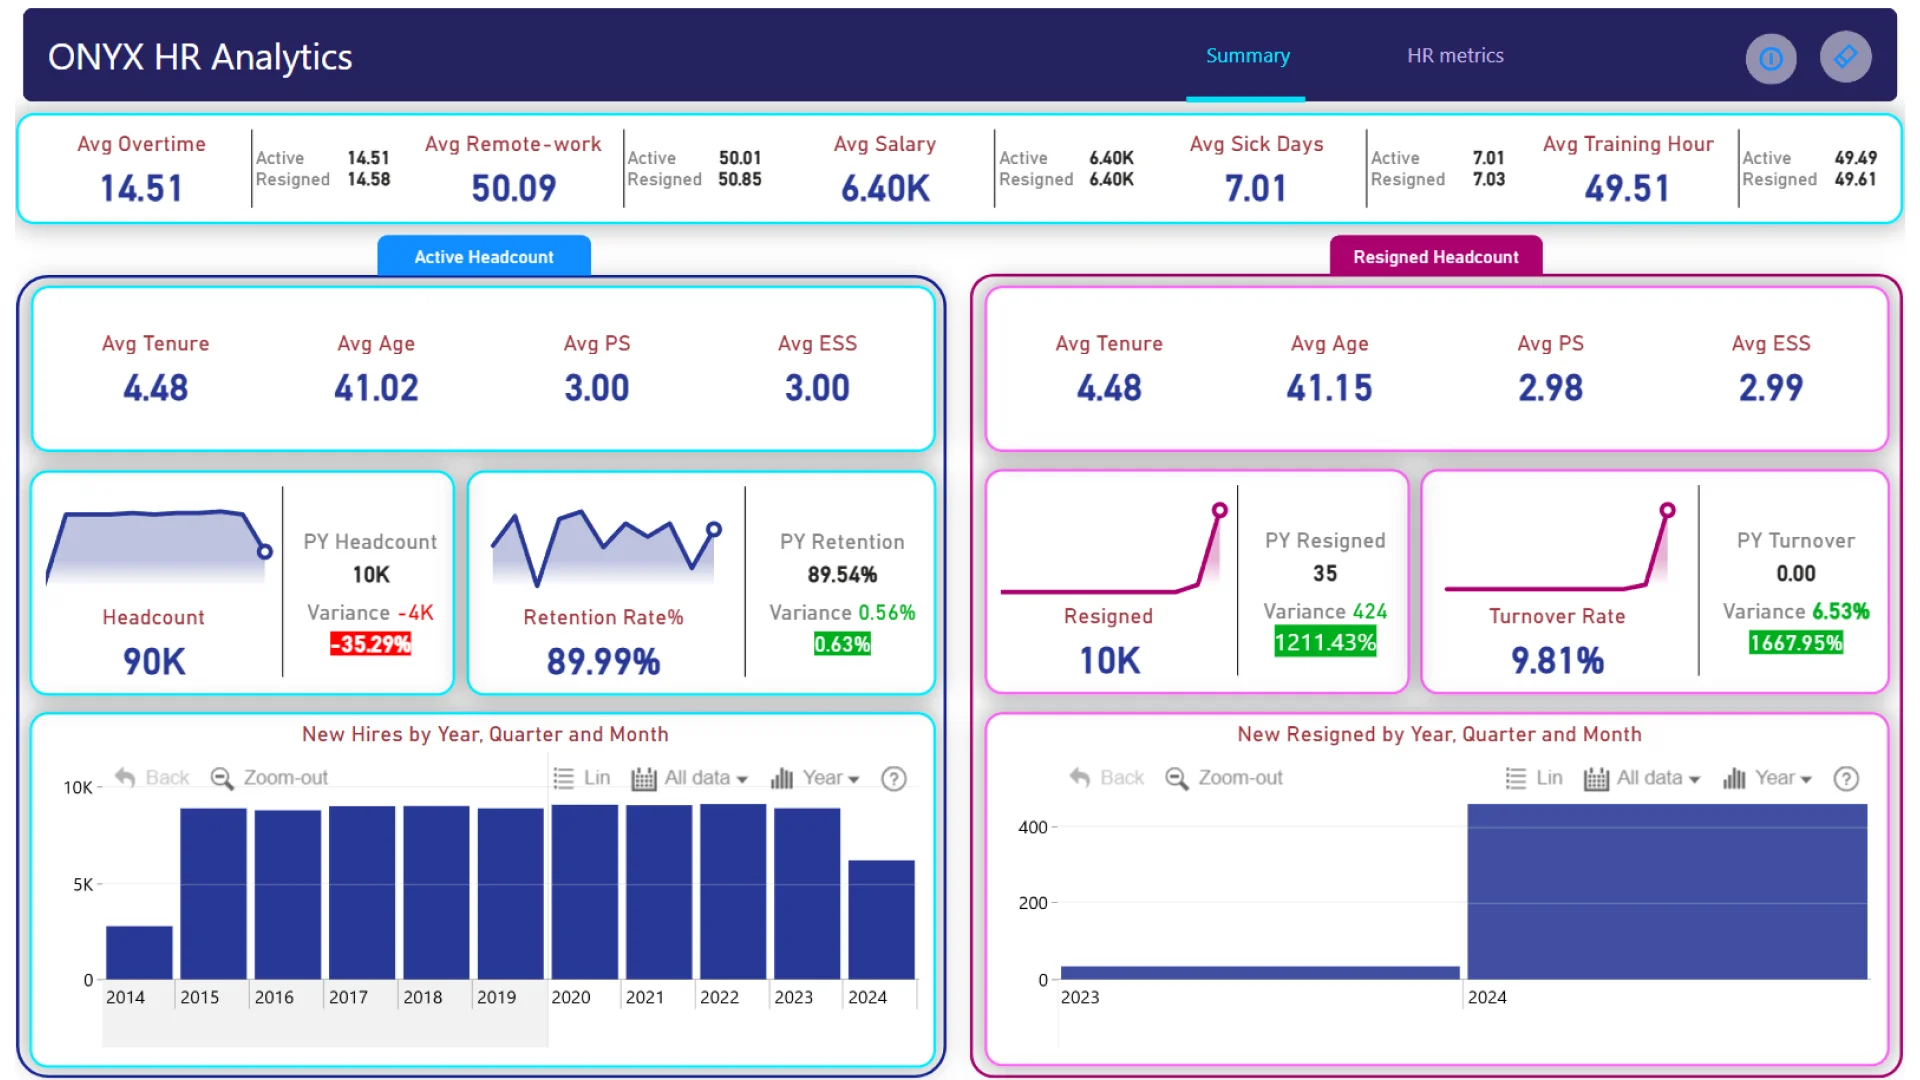
Report submitted for Onyx Data DataDNA ZoomCharts Mini Challenge, October 2024. The report was built based on Employee Performance dataset and includes ZoomCharts custom Drill Down PRO visuals for Power BI.
Author's description:
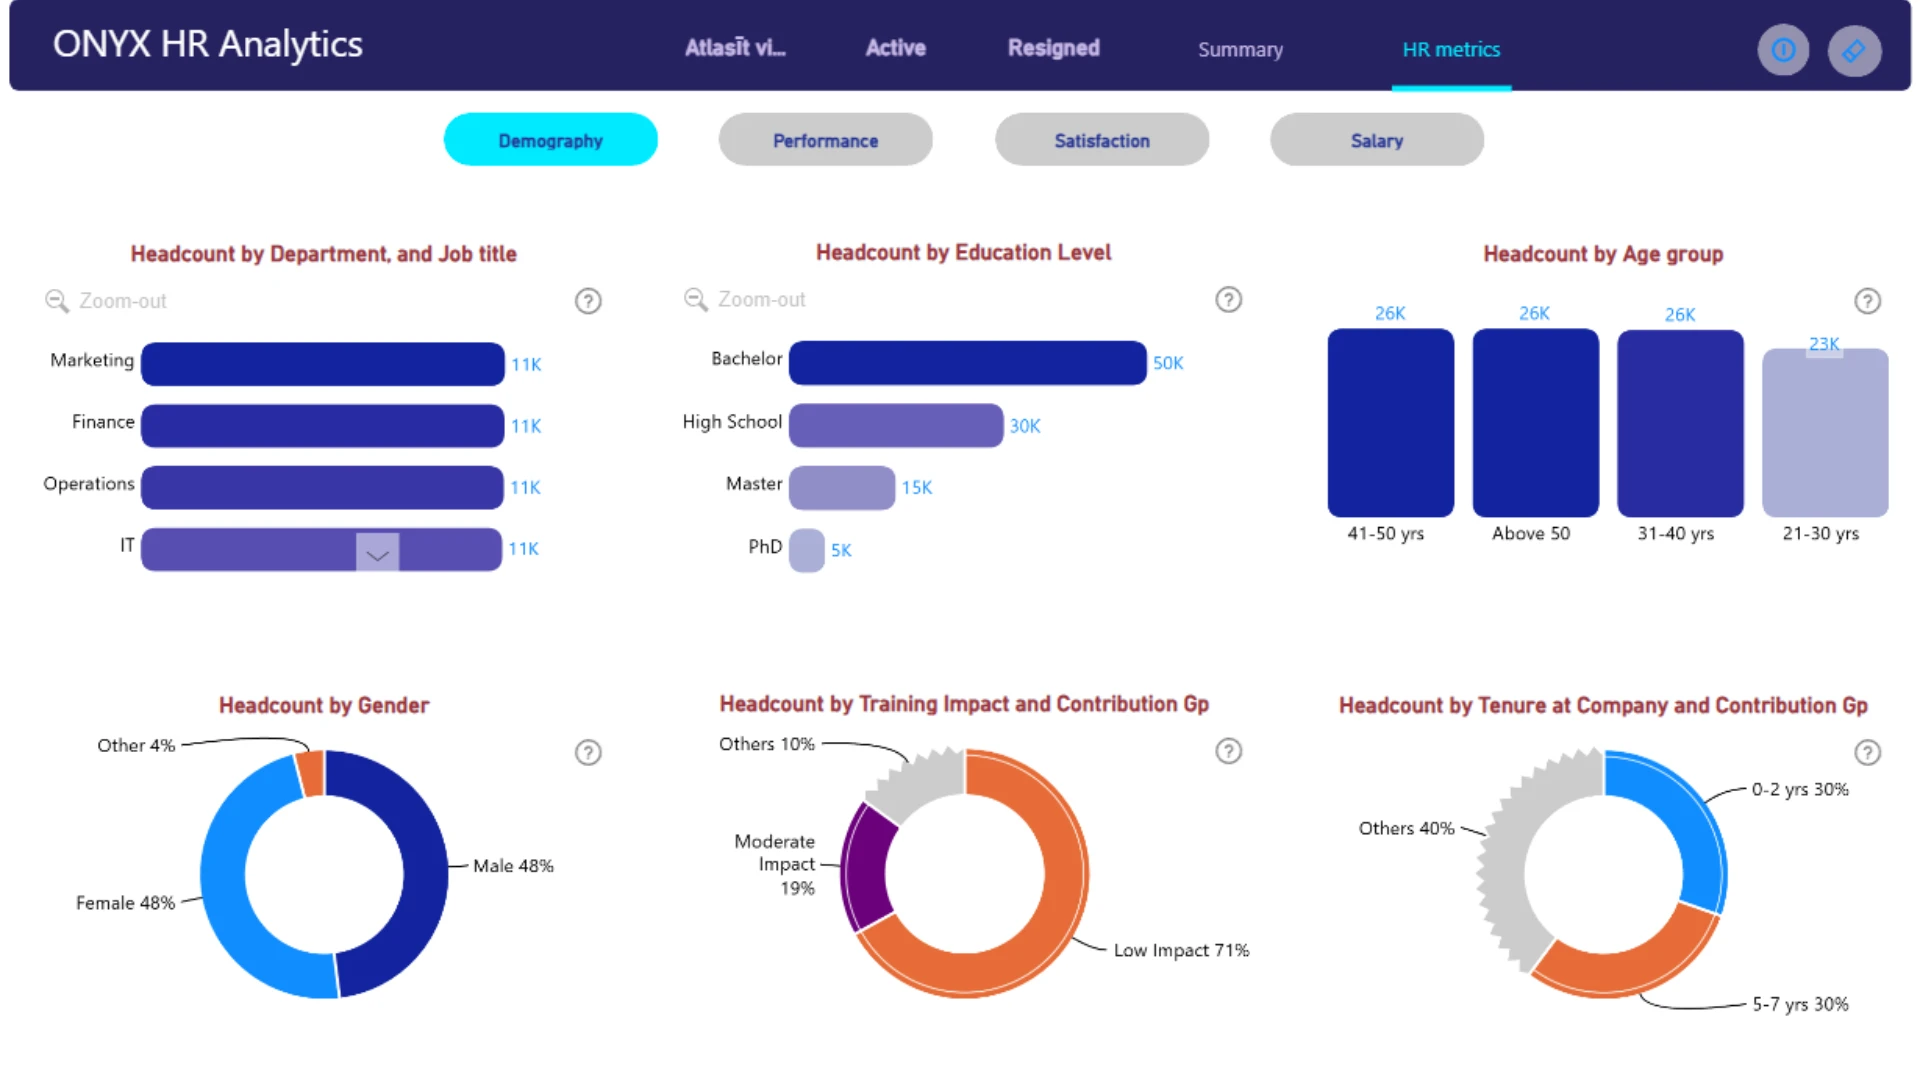
An insghtful HR Analytics Report, where I uncovered some intriguing trends across salary, performance, and demographics!
📊 Here are some of the standout findings:
💼 Salary Insights: - Consistent salaries across departments, education levels, and years of tenure at $6K. - Initial engagement employees lead with the highest average salary ($8K). - Interestingly, employees with low training impact earn more ($7K) than those with high/exceptional impacts ($5K).
📈 Performance Metrics: - Increased overtime and remote work are linked to decreased performance. - Performance improves slightly at higher overtime levels and with larger team sizes. - Tenure has a non-linear effect on performance.
📈 Satisfaction: - Satisfaction drops as overtime increases, with a sharp decline beyond 15 hours. - Satisfaction improves with more remote work, peaking around 50 days. - Smaller teams and fewer work hours (peaking around 44 hours/week) lead to higher satisfaction. - Satisfaction rises with tenure but significantly drops after 4.8 years.
🧑🤝🧑 Demographics: - Equal distribution of employees across Marketing, Finance, Operations, and IT. - Balanced gender representation (48% male, 48% female).
ZoomCharts visuals used





4U Report Challenges
Participate in data challenges, build and submit reports to get free template downloads.
Join CommunityMobile view allows you to interact with the report. To Download the template please switch to desktop view.



How to use a PBIX template
Preview the interactive report, download the PBIX file, open it in Power BI Desktop, and replace the same data connection with your own dataset.
Preview and download
Explore the report online and download the PBIX template file.
Open in Power BI Desktop
Open the downloaded PBIX file in Power BI Desktop.
Connect your data
Replace the sample data source with your own dataset.
Refresh and adjust
Refresh the model and update fields or visual were needed.
Save and share
Save your report and publish it for your audience.


