1326
Onyx Data November 2024 Challenge!
Onyx Data November 2024 Challenge!
Report Author: Md Mizanur Rahman Nayan
1326
Share template with others
Report submitted for Onyx Data DataDNA ZoomCharts Mini Challenge, November 2024. The report is based on the Supply Chain Analysis dataset and includes ZoomCharts custom Drill Down PRO visuals for Power BI.
Author's description:
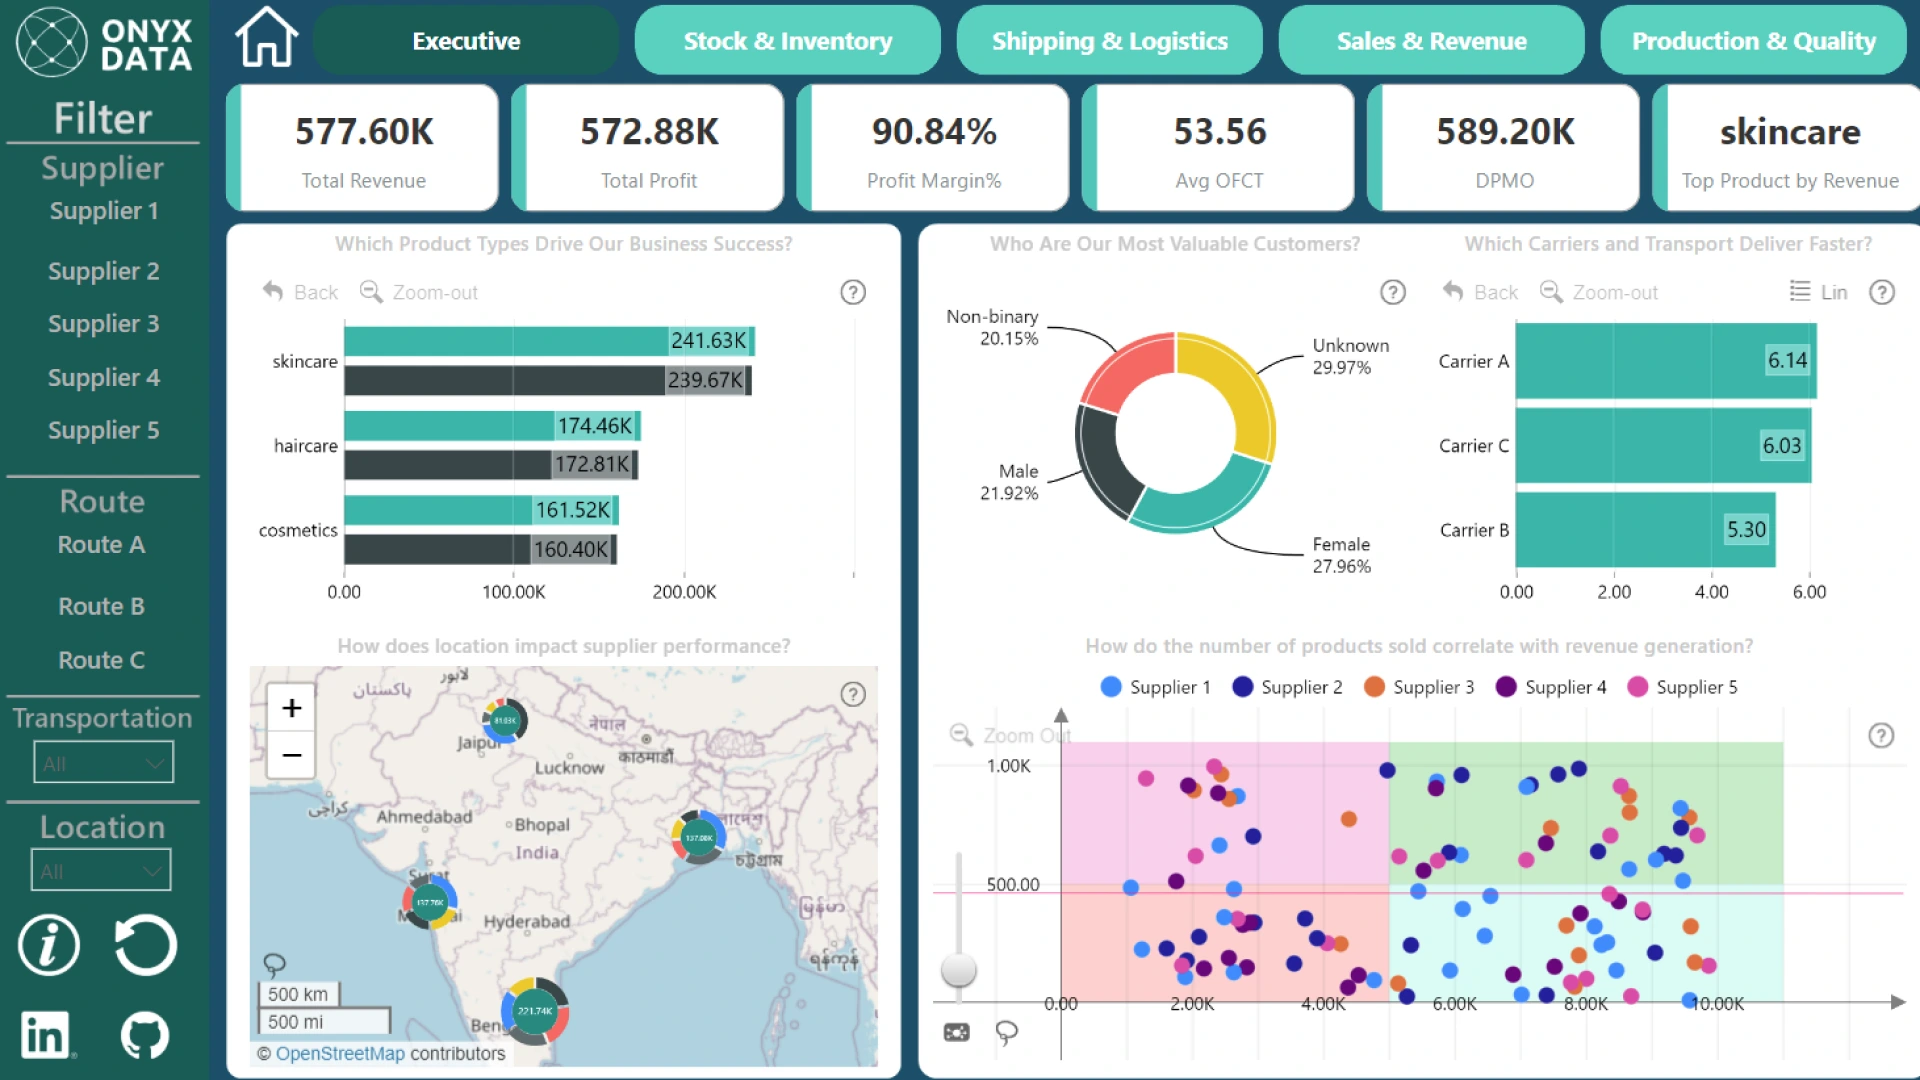
🚀 Highlights of My Report I designed a Logistics Report that explores: Stock and Inventory: Tracking stock availability, inventory turnover, and overstocked SKUs with low sales. Shipping & Logistics: Comparing shipping costs by carrier, routes, and transportation modes. Sales & Revenue: Identifying top-performing SKUs and revenue trends across regions. Production & Quality: Analyzing defects per million opportunities (DPMO) and production efficiency.
🔍 Key Insights Discovered Stock Optimization: Identified SKUs with high stock levels but low sales for action. Shipping Performance: Carrier B emerged as the most efficient, reducing both cost and time. Regional Demand Analysis: Pinpointed regions with demand-supply imbalances using map visualizations. Production Metrics: Correlated defect rates with production times to enhance quality control.
ZoomCharts visuals used
4U Report Challenges
Participate in data challenges, build and submit reports to get free template downloads.
Join CommunityMobile view allows you to interact with the report. To Download the template please switch to desktop view.
Was this helpful? Thank you for your feedback!
Sorry about that.
How can we improve it?