652
Onyx Data -DataDNA Dataset Challenge - Udemy Courses - January 2024 2
Onyx Data -DataDNA Dataset Challenge - Udemy Courses - January 2024 2
Report Author: Yash Sonkhiya
652
Share template with others
Report submitted for Onyx Data DataDNA ZoomCharts Mini Challenge, January 2024. The report was built based on Udemy Courses dataset and includes ZoomCharts custom Drill Down PRO visuals for Power BI.
Author's description:
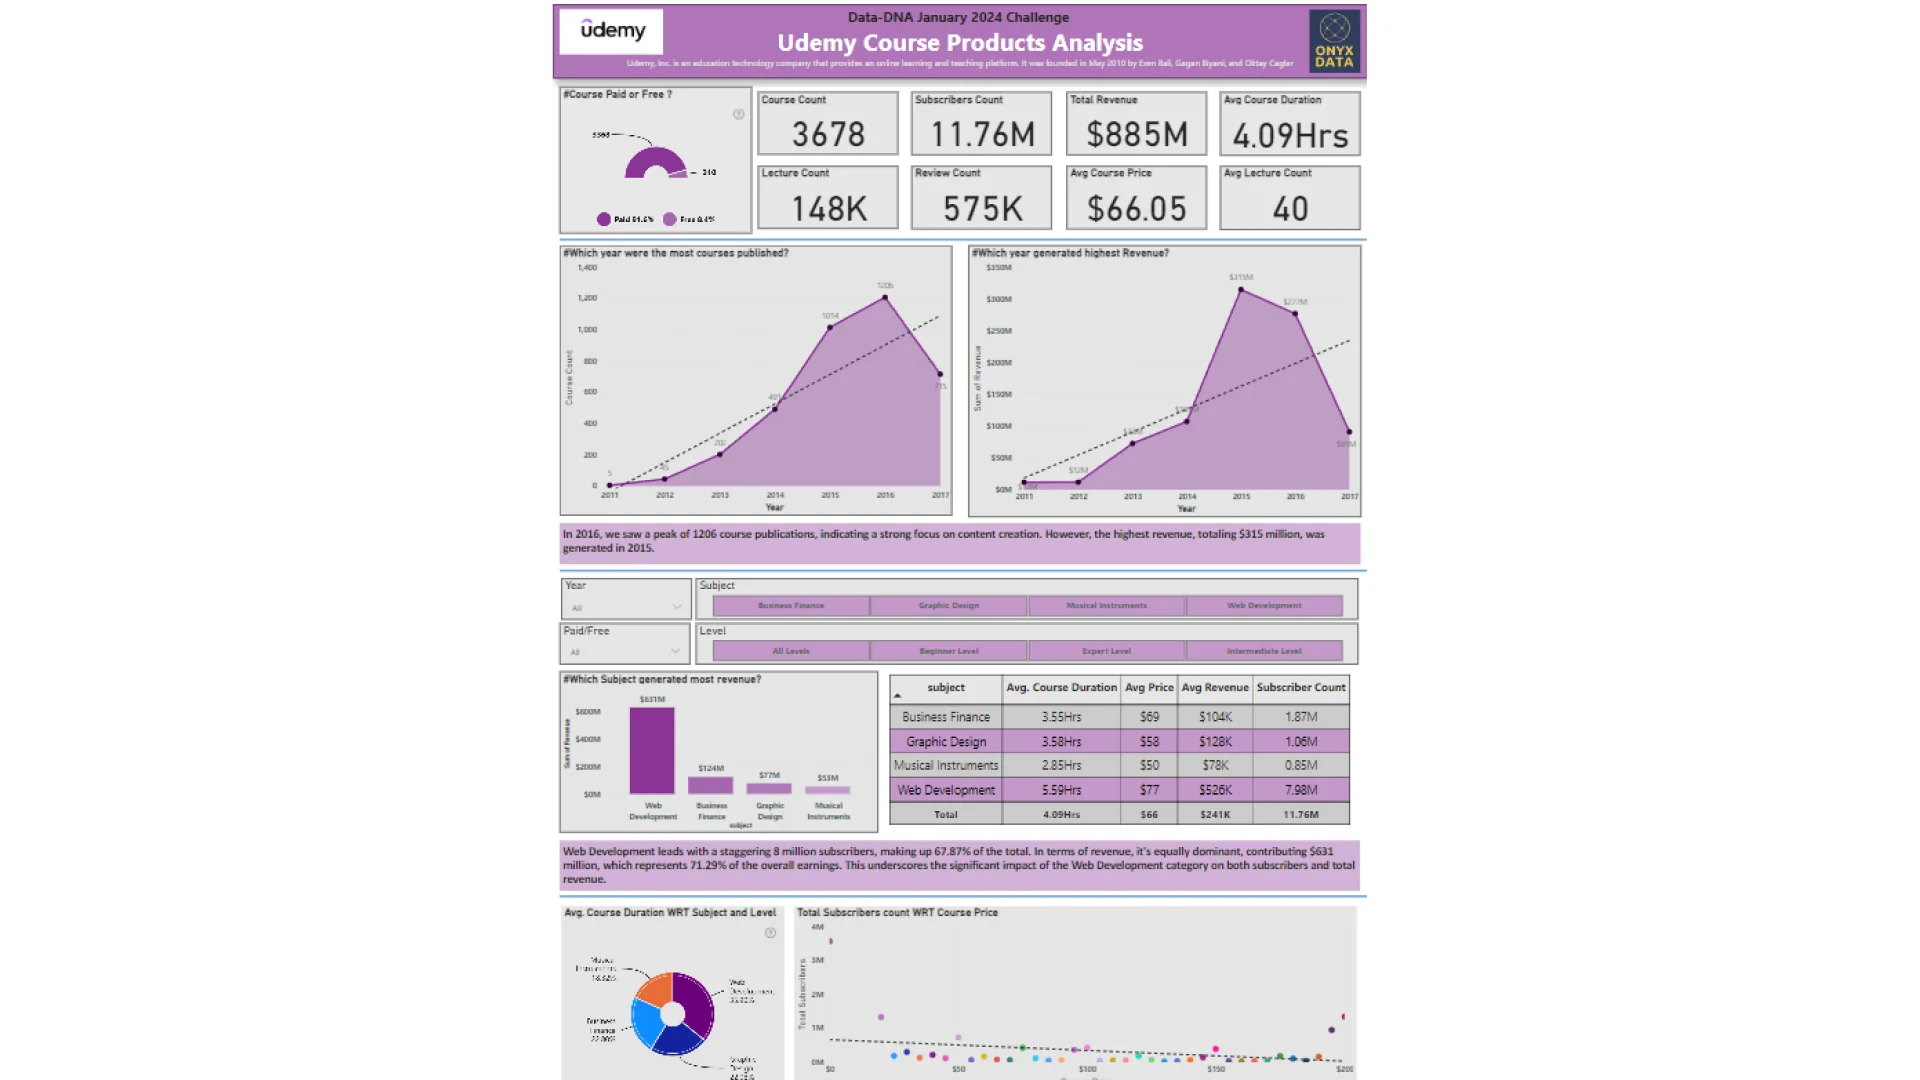
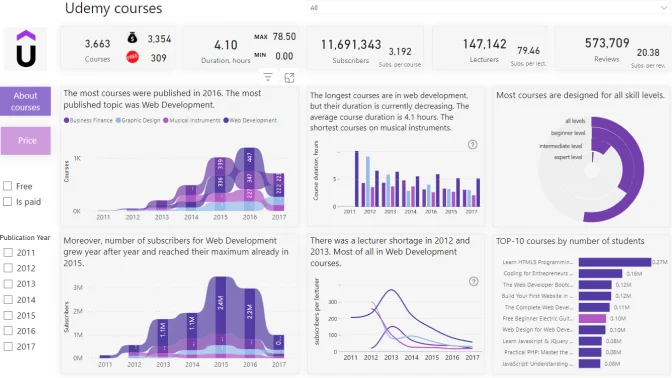
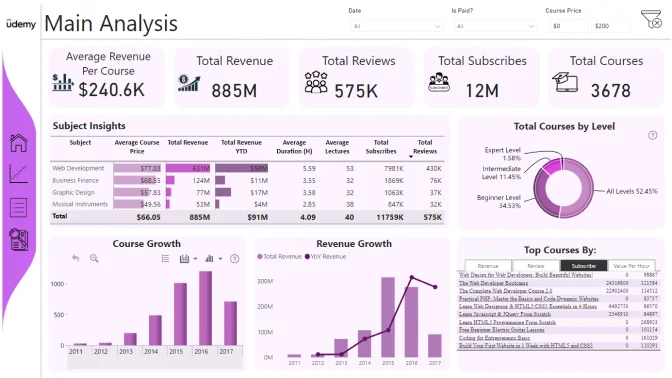
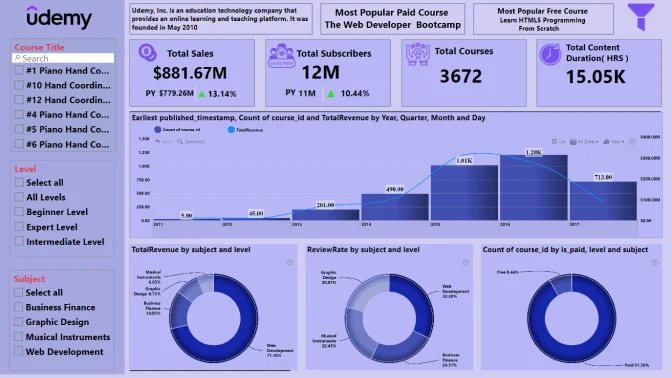
The Udemy Analytics Dashboard, a project developed for the ONYX DATA - Data DNA Dataset Challenge, provides a comprehensive analysis of Udemy's online course platform. Leveraging Power BI and Excel, the dashboard highlights key insights, including the dominance of paid courses (91.6%), the impact of Web Development on revenue and subscribers, and trends in yearly course publications. Special thanks to ONYX DATA and ZoomCharts for their contributions.
ZoomCharts visuals used
4U Report Challenges
Participate in data challenges, build and submit reports to get free template downloads.
Join CommunityMobile view allows you to interact with the report. To Download the template please switch to desktop view.
Was this helpful? Thank you for your feedback!
Sorry about that.
How can we improve it?