902
Onyx Data -DataDNA Dataset Challenge - Top 1000 YouTubers - November 2023
Onyx Data -DataDNA Dataset Challenge - Top 1000 YouTubers - November 2023
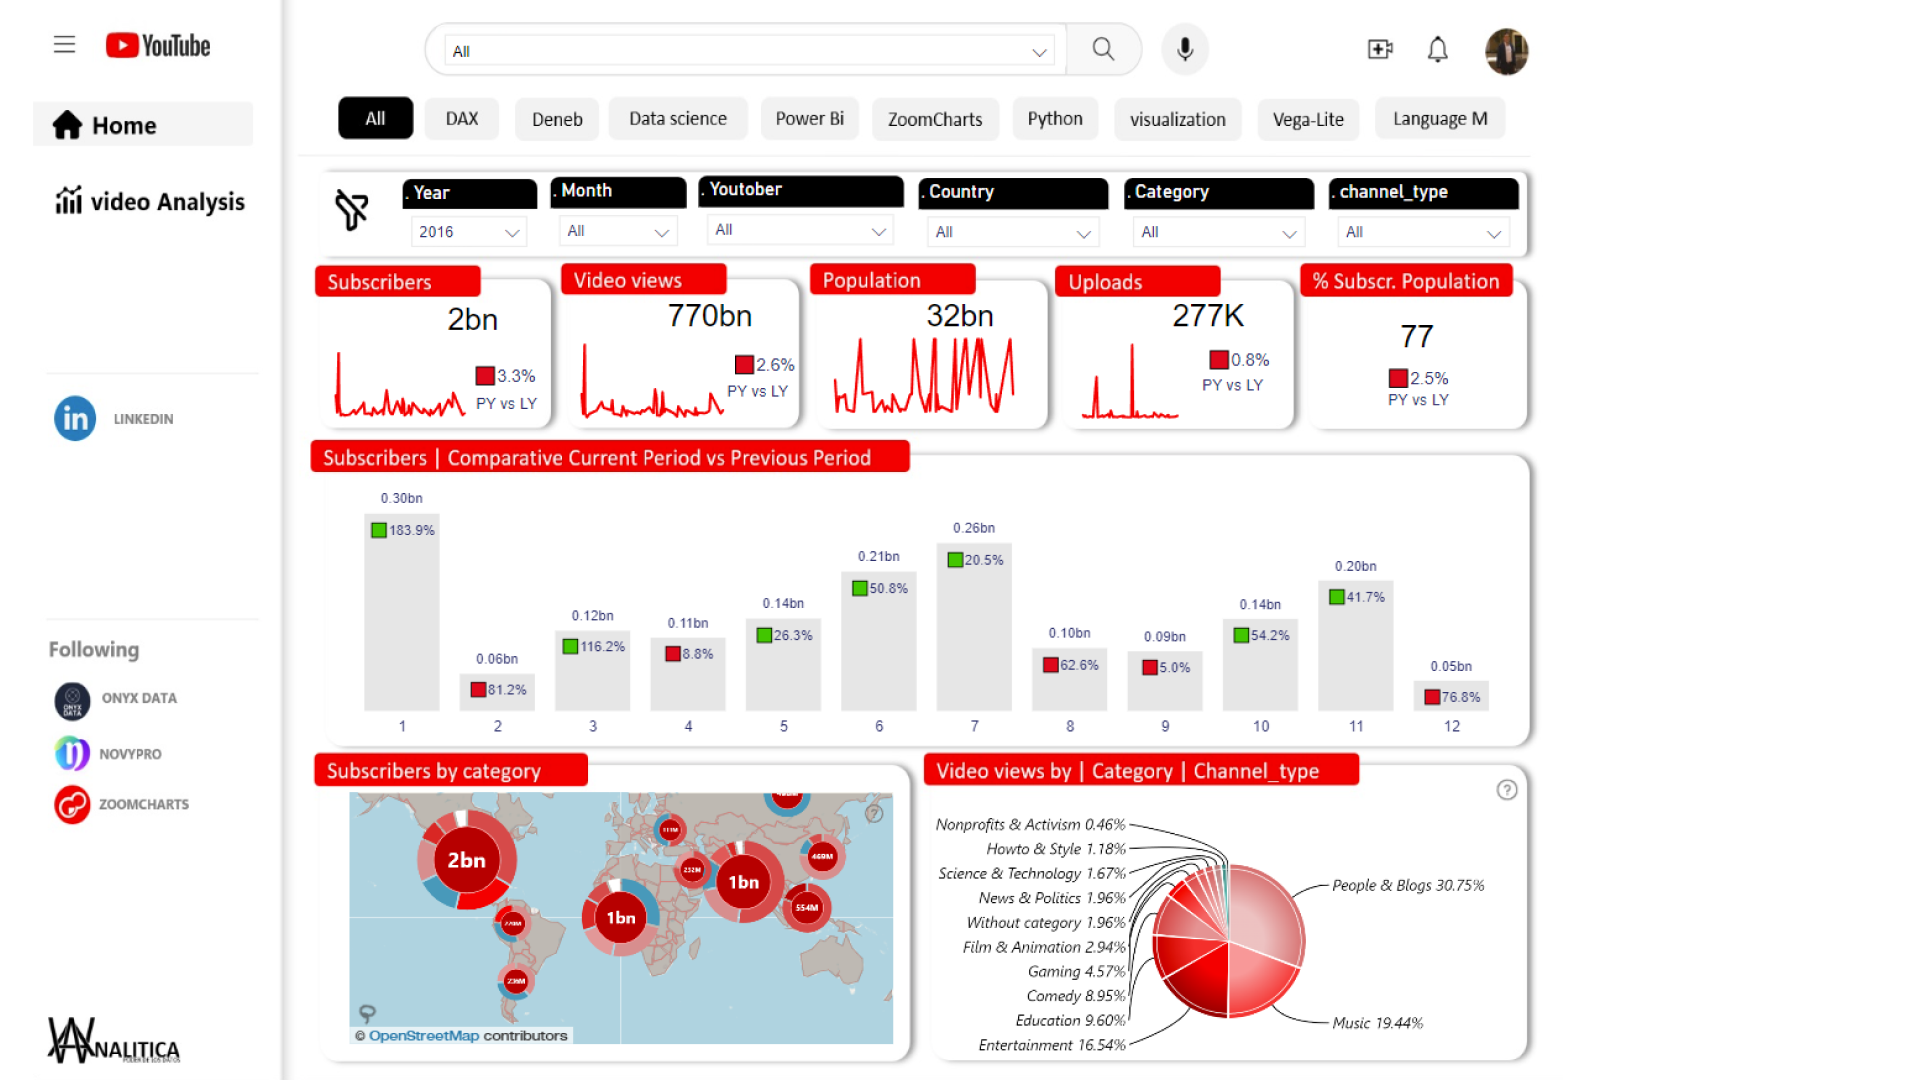
Report Author: Wilder Manzano
902
Share template with others
Report submitted for Onyx Data DataDNA ZoomCharts Mini Challenge, November 2023. The report was built based on Top YouTubers dataset and includes ZoomCharts custom Drill Down PRO visuals for Power BI.
Author's description:
I share the analysis on the data set of the top 1000 YouTubers challenge. It is quite interesting to see how the traffic of a streaming platform like YouTube behaves. In this area we can also develop strong growth projects using historical data and together with a go to market strategy we could exponentially increase the monetization of the present channels.
Analyzing the project: The year in which the highest subscribers are evident is 2006, with great penetration in India. It is evident that for the year 2006, we have 91 YouTubers who have generated 55.01T total general views. This has generated the highest income in the year to be $108.4M, 91 titles viewed in general total have been generated Over the years, the category that generates the most participation is: music.



4U Report Challenges
Participate in data challenges, build and submit reports to get free template downloads.
Join CommunityMobile view allows you to interact with the report. To Download the template please switch to desktop view.
How to use a PBIX template
Preview the interactive report, download the PBIX file, open it in Power BI Desktop, and replace the same data connection with your own dataset.
Preview and download
Explore the report online and download the PBIX template file.
Open in Power BI Desktop
Open the downloaded PBIX file in Power BI Desktop.
Connect your data
Replace the sample data source with your own dataset.
Refresh and adjust
Refresh the model and update fields or visual were needed.
Save and share
Save your report and publish it for your audience.


