733
North America Population and Urbanization Analysis
North America Population and Urbanization Analysis
Report Author: Abaid Ullah
733
Share template with others
Report submitted for Onyx Data DataDNA ZoomCharts Mini Challenge, February 2025. The report is based on the Demographic and Urbanization dataset and includes ZoomCharts custom Drill Down PRO visuals for Power BI.
Authors Description
Key Elements from My Analysis 📌
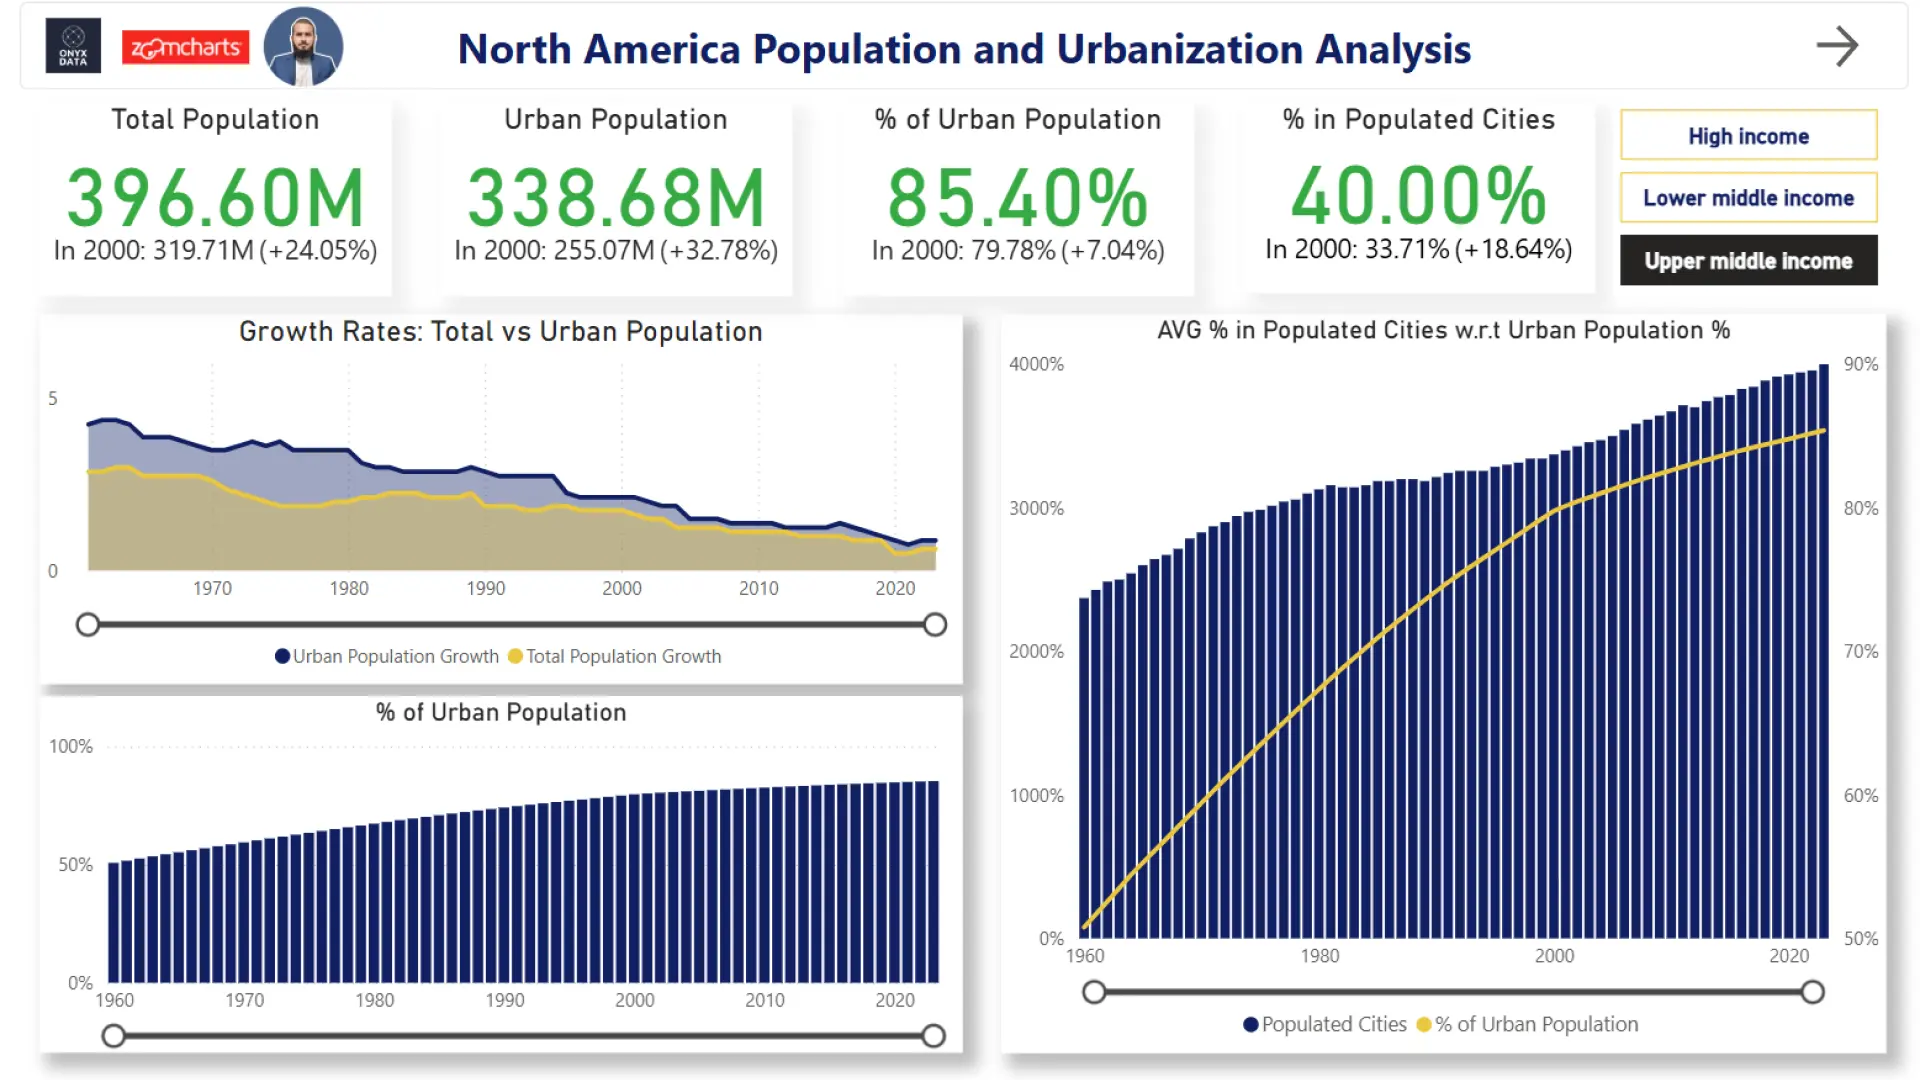
📊 Overview Page
Comparing current figures vs. the year 2000 for:
✔️ Total Population
✔️ Urban Population
✔️ Urbanization Percentage
✔️ Percentage of People Living in Big Cities
📌 Time Series Analysis
Examining long-term trends using:
✔️ Stacked Area Chart – Tracking total and urban population growth over time.
✔️ Column Chart – Understanding urban population as a percentage of the total population.
✔️ Line & Clustered Column Chart – Comparing urban vs. big-city population growth.
📌 Country-Level Analysis
Filtering insights by income groups to reveal:
✔️ Total vs. Urban Population (Clustered Column Chart)
✔️ Compound Annual Growth Rate (CAGR) Comparison (Clustered Column Chart)
✔️ Yearly Performance of Different Indicators (Matrix)
✔️ Big City Population Concentration (Drill Down Map PRO)
4U Report Challenges
Participate in data challenges, build and submit reports to get free template downloads.
Join CommunityMobile view allows you to interact with the report. To Download the template please switch to desktop view.

Was this helpful? Thank you for your feedback!
Sorry about that.
How can we improve it?