894
Mobile Game Analysis 2
Mobile Game Analysis 2
Report Author: Sweety Antoni David
894
Share template with others
Report submitted for FP20 Analytics ZoomCharts Challenge 18 (August 2024). The report was built with the Mobile Game Analysis dataset and includes ZoomCharts custom Drill Down PRO visuals for Power BI.
Author's description:
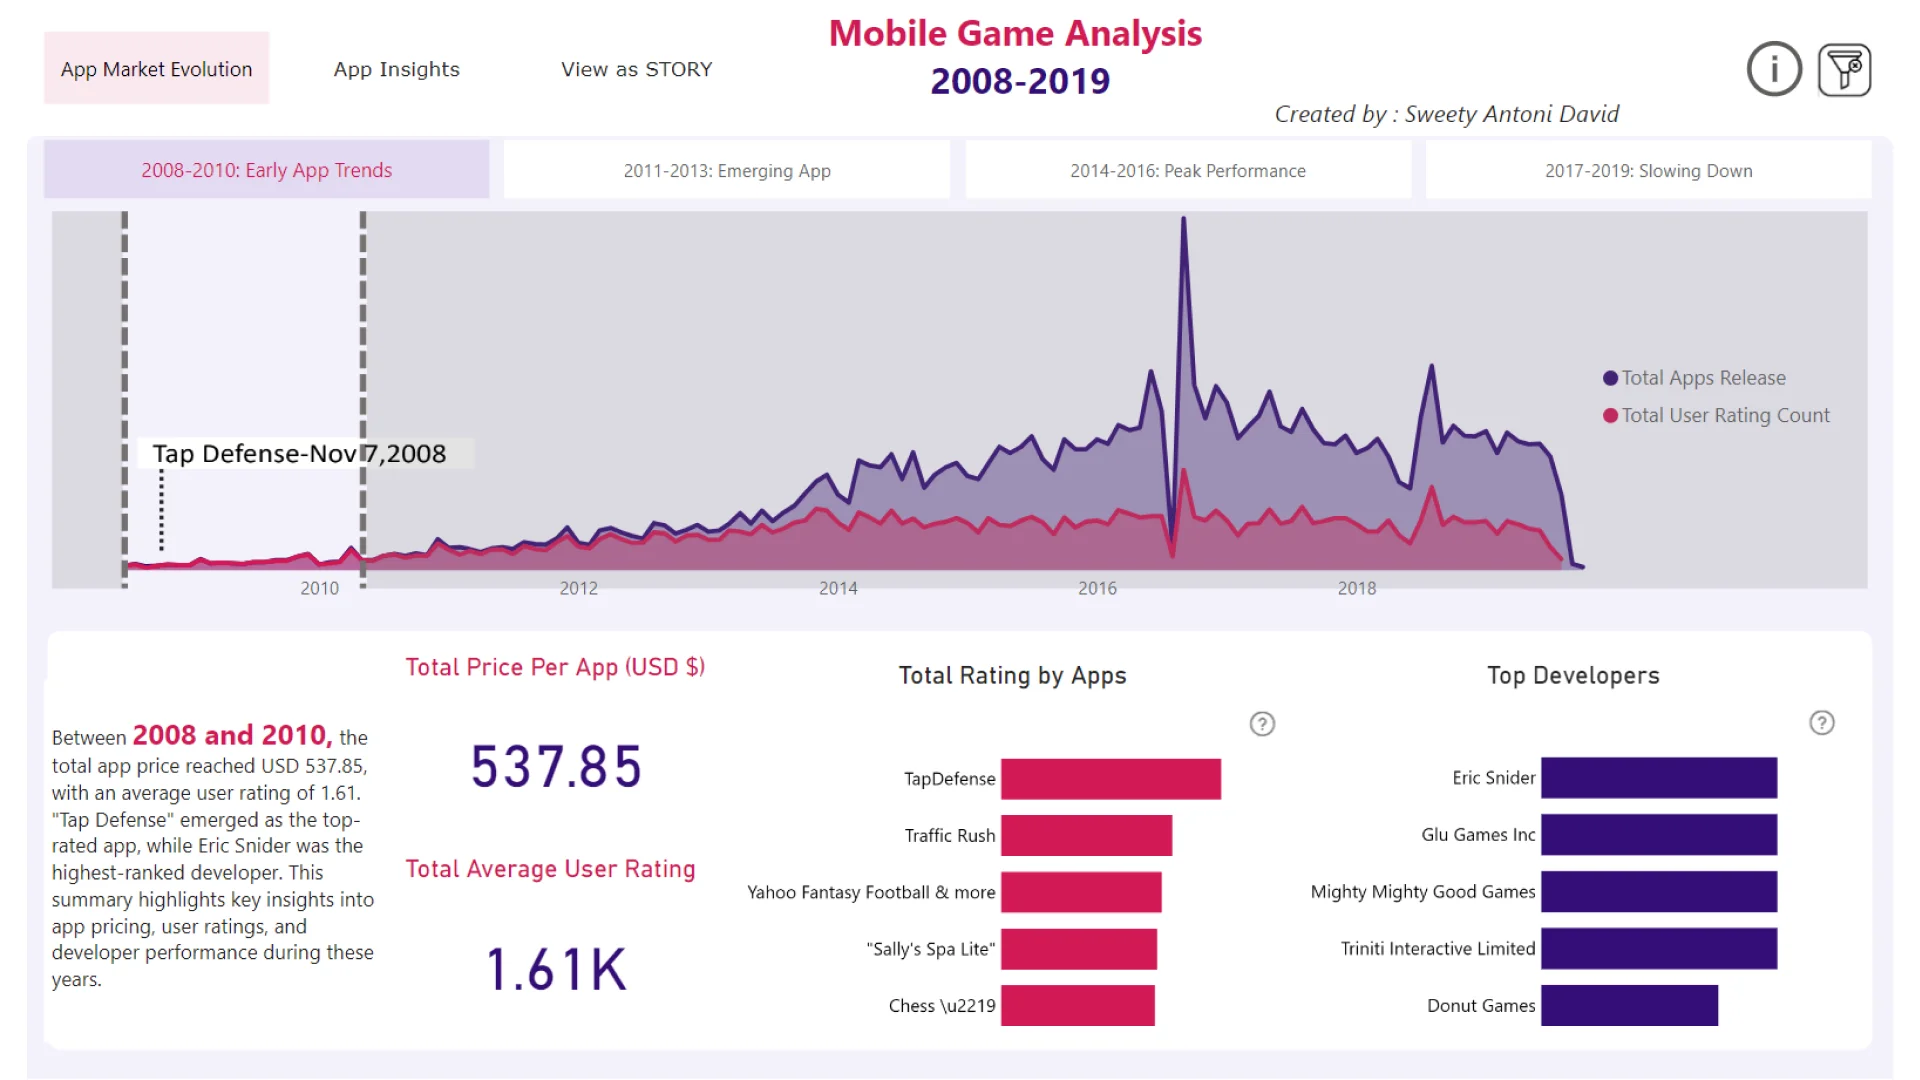
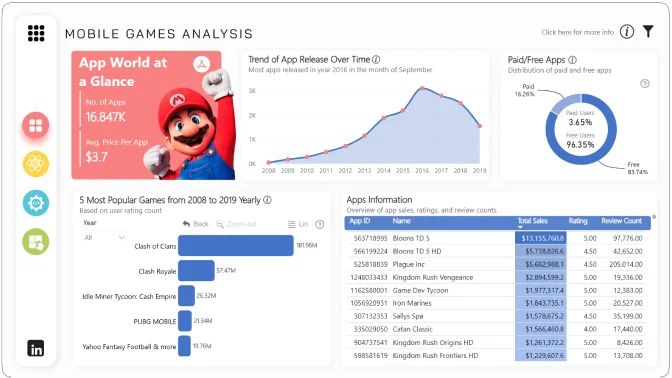
Summary : From 2008 to 2019, app prices and user ratings for mobile games showed significant fluctuations. "Tap Defense," "Clash of Clans," "Clash Royale," and "PUBG Mobile" were the top-rated apps in their respective periods. English was the dominant language, with over 15,000 users, vastly outnumbering Arabic. Paid apps garnered 33% of average ratings, while free apps led with 67%. An increase in app size correlated with rising prices, peaking at $6.85K for 317 billion bytes in 2016.
4U Report Challenges
Participate in data challenges, build and submit reports to get free template downloads.
Join CommunityMobile view allows you to interact with the report. To Download the template please switch to desktop view.
Was this helpful? Thank you for your feedback!
Sorry about that.
How can we improve it?