755
Mobile Game Analysis 10
Mobile Game Analysis 10
Report Author: Agbata Dickson Ukolojo
755
Share template with others
Report submitted for FP20 Analytics ZoomCharts Challenge 18 (August 2024). The report was built with the Mobile Game Analysis dataset and includes ZoomCharts custom Drill Down PRO visuals for Power BI.
Author's description:
The report is divided into four sections: Overview, Developers, Games, and Genres.
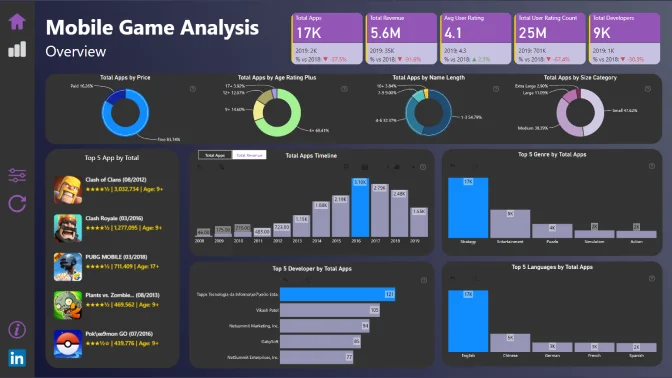
1. Overview: This section includes the app count by year, the top 5 popular games, user counts every three years, and the top 5 languages used in app development.
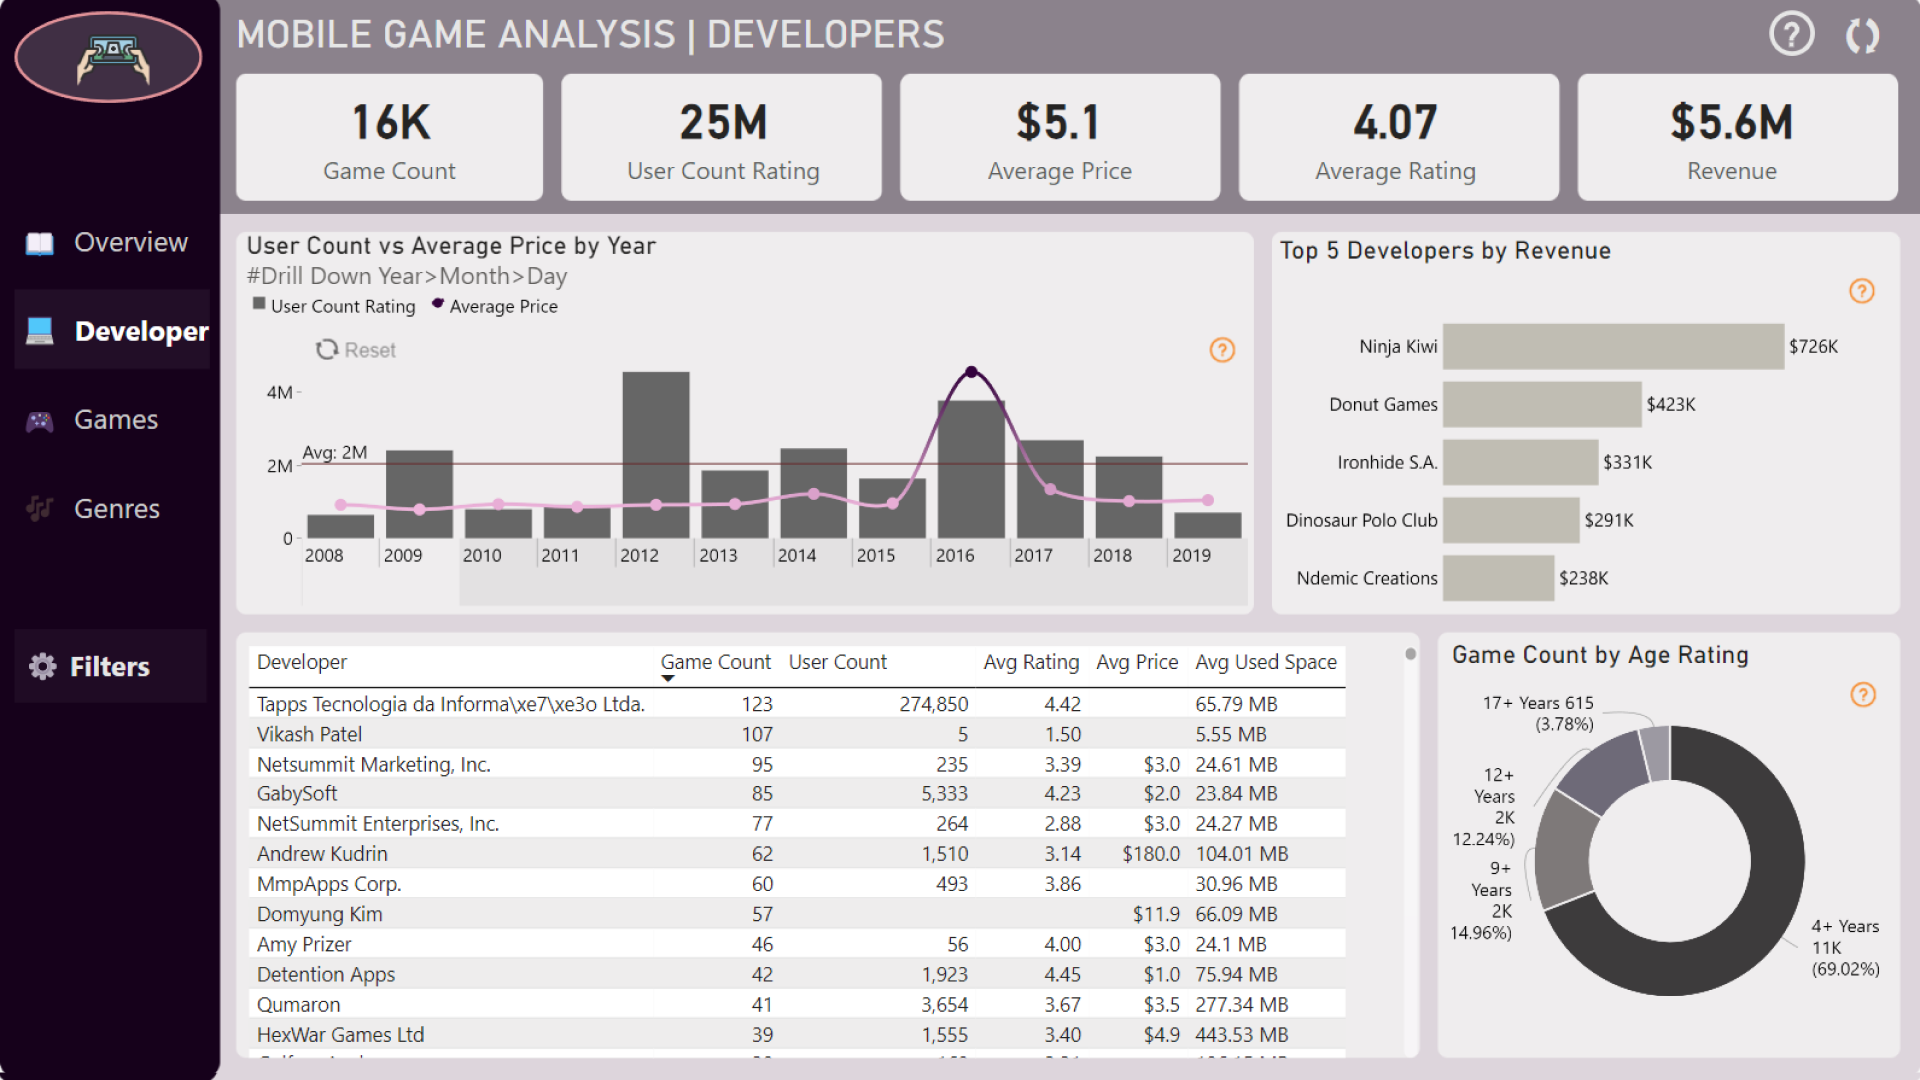
2. Developers: This section features the user count by year and average price, the top 5 developers by income, and the age rating targets.
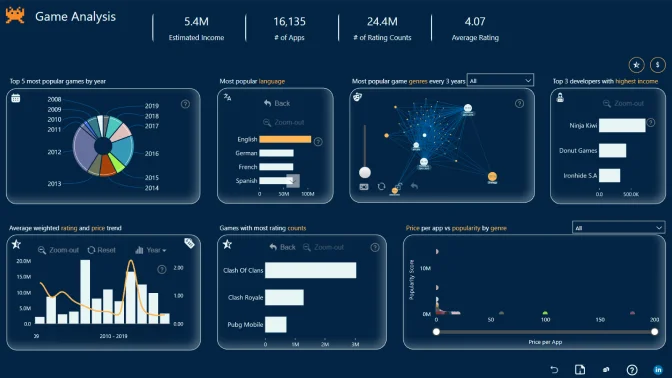
3. Games: This section presents the average game rating by year, the game count categorized by free/paid, and the game user count.
4. Genres: This section includes a table showing the two types of genres, along with their game count, user count, revenue, and the year-over-year growth rate percentage for both games and users.
4U Report Challenges
Participate in data challenges, build and submit reports to get free template downloads.
Join CommunityMobile view allows you to interact with the report. To Download the template please switch to desktop view.
Was this helpful? Thank you for your feedback!
Sorry about that.
How can we improve it?