673
Merchandize Sales Analysis- Lee Chatmen's Merch: The Numbers
Merchandize Sales Analysis- Lee Chatmen's Merch: The Numbers
Report Author: Ugochukwu Nwasuruba
673
Share template with others
Report submitted for Onyx Data DataDNA ZoomCharts Mini Challenge, January 2025. The report is based on the Merchandise Sales dataset and includes ZoomCharts custom Drill Down PRO visuals for Power BI.
Author's description:
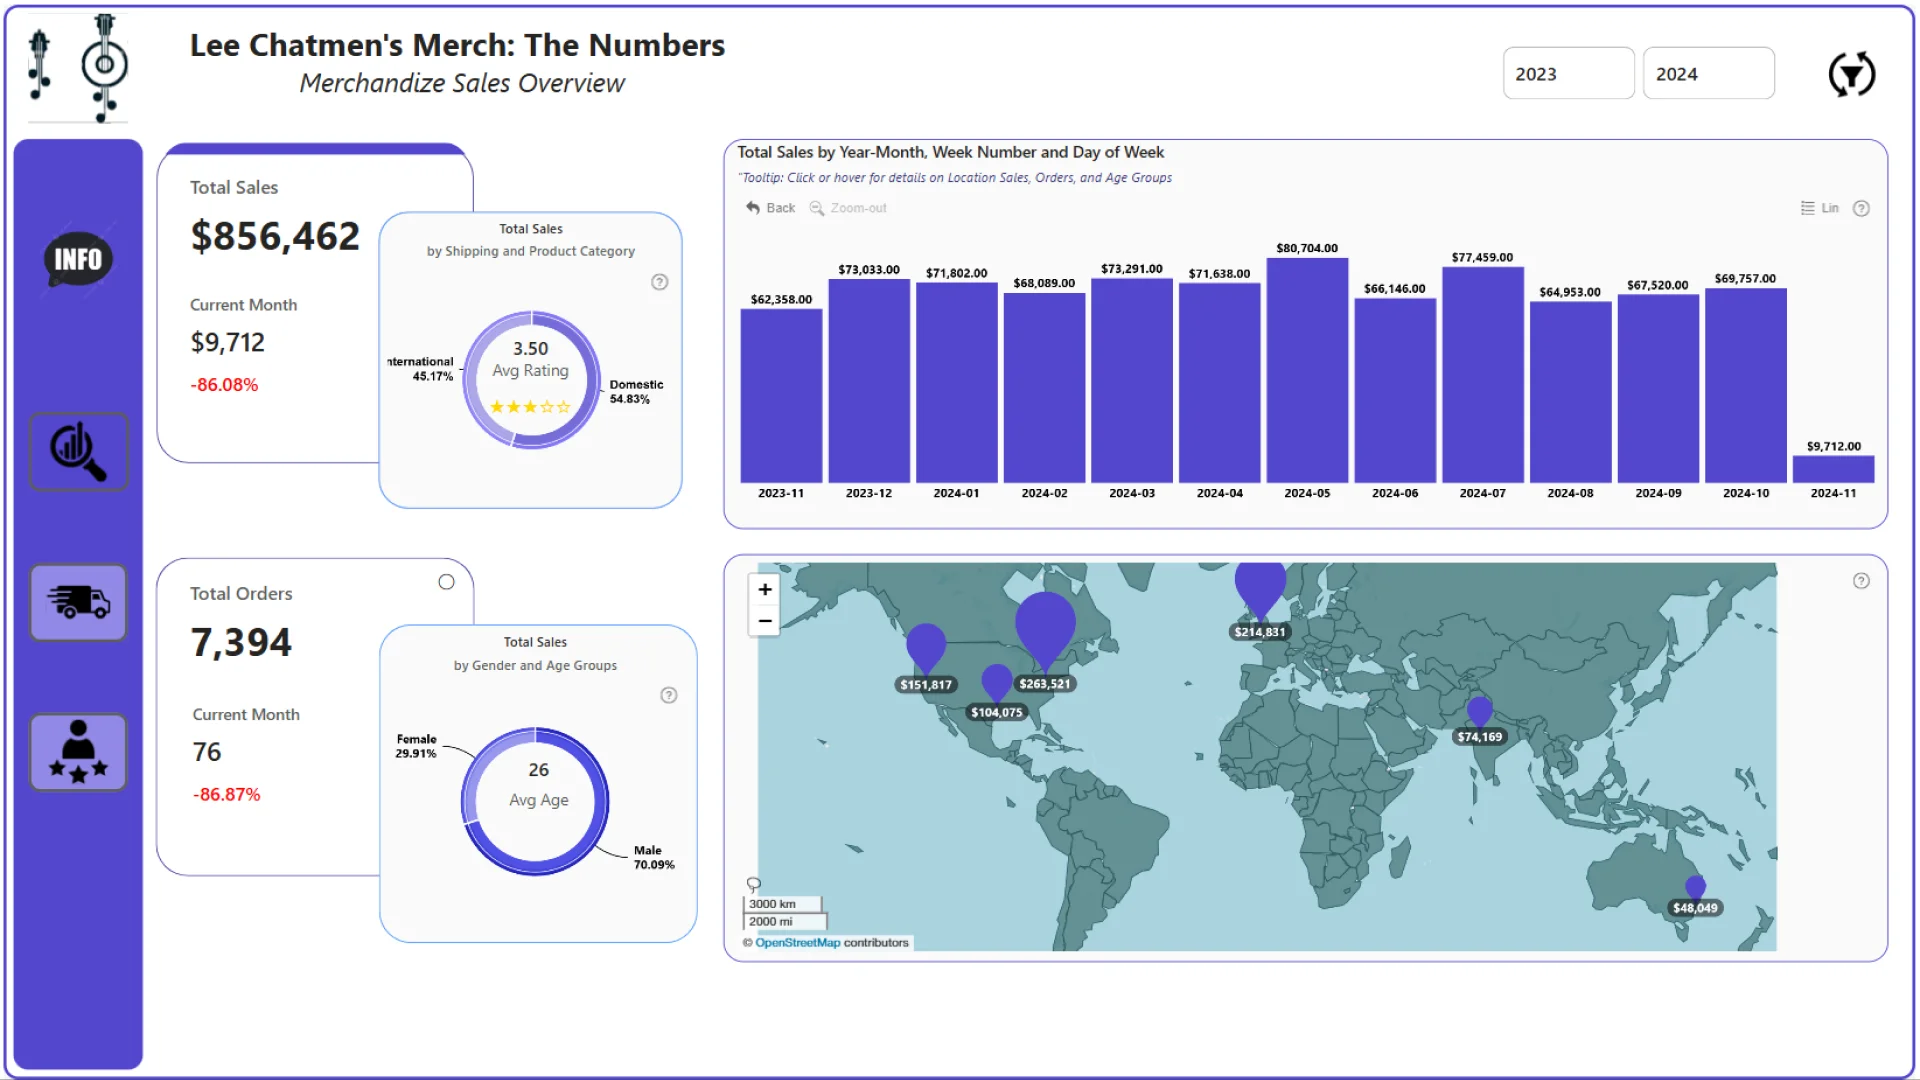
This analysis dives into the merchandise sales of TikTok influencer Lee Chatmen, who launched his own product line in 2023. Using Power BI, the report explores: Sales Overview: Total Sales ($856K) and Orders (7.4K), with buyer demographics. Shipping & Quantity: Shipping revenue trends ($91K) and product shipments (10.3K items). Reviews & Ratings: Customer feedback (6.2K reviews, avg. rating 3.51 stars) and sentiment analysis. Interactive features include drill-through visuals, slicers, and navigation buttons to enhance usability and uncover actionable insights for optimizing performance and customer satisfaction.
ZoomCharts visuals used
4U Report Challenges
Participate in data challenges, build and submit reports to get free template downloads.
Join CommunityMobile view allows you to interact with the report. To Download the template please switch to desktop view.

Was this helpful? Thank you for your feedback!
Sorry about that.
How can we improve it?