882
Merchandize Sales Analysis
Merchandize Sales Analysis
Report Author: Rami Kassiar
882
Share template with others
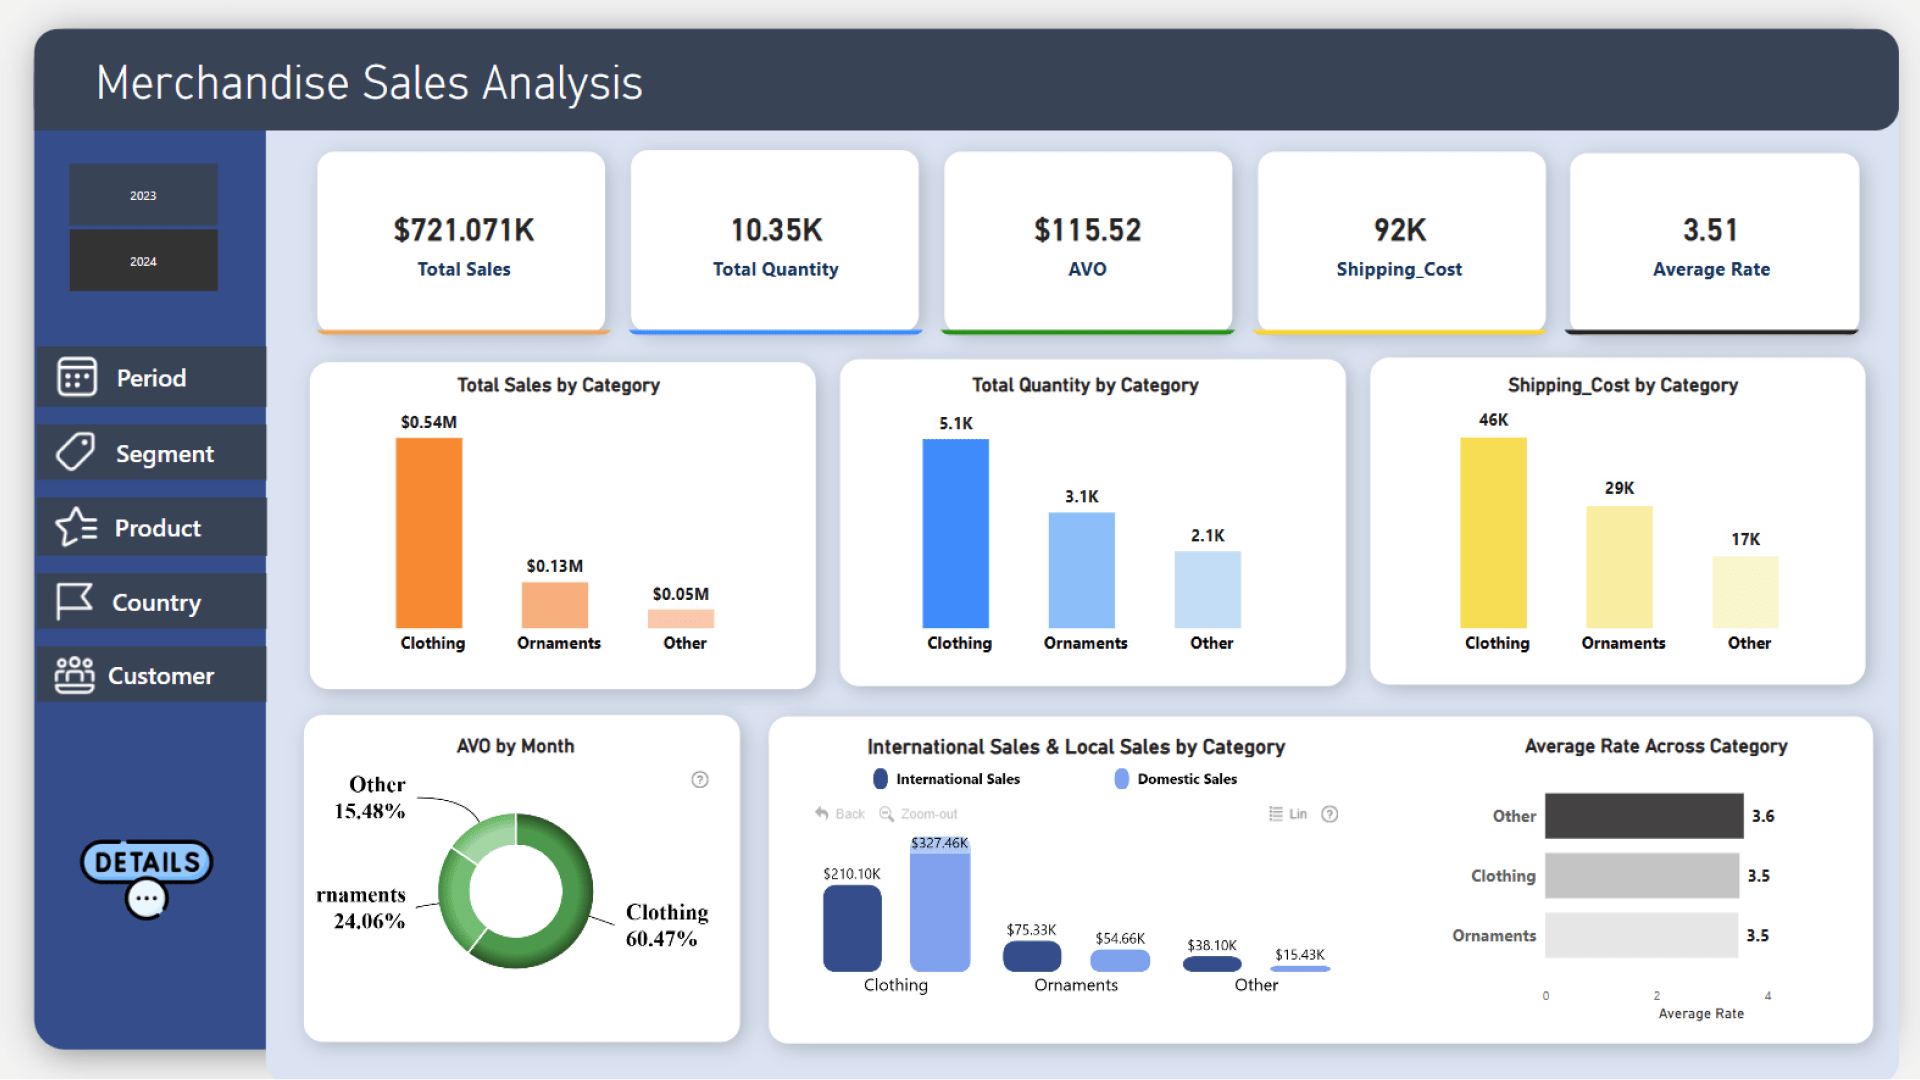
Report submitted for Onyx Data DataDNA ZoomCharts Mini Challenge, January 2025. The report is based on the Merchandise Sales dataset and includes ZoomCharts custom Drill Down PRO visuals for Power BI.
Author's description:
For this challenge, I developed a highly interactive and dynamic Power BI report to deliver an in-depth analysis of sales performance. The report offers insights across various dimensions, including different time periods, product categories, individual products, and geographic regions (countries). To enhance decision-making, I incorporated visualizations such as line charts, bar charts, and maps for a clear representation of trends and patterns. Additionally, I included a dedicated page featuring a detailed table, providing a granular, comprehensive view of sales data for deeper analysis and better business understanding.
ZoomCharts visuals used




4U Report Challenges
Participate in data challenges, build and submit reports to get free template downloads.
Join CommunityMobile view allows you to interact with the report. To Download the template please switch to desktop view.
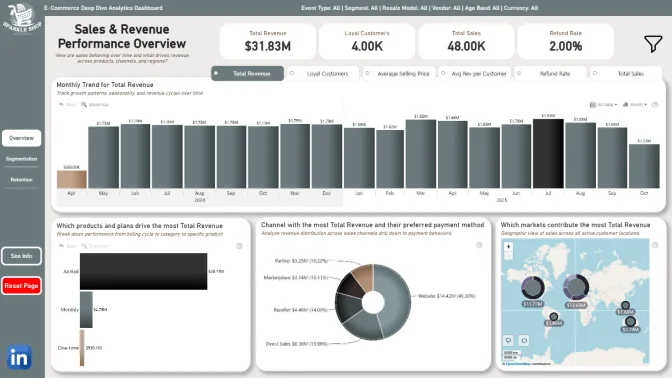
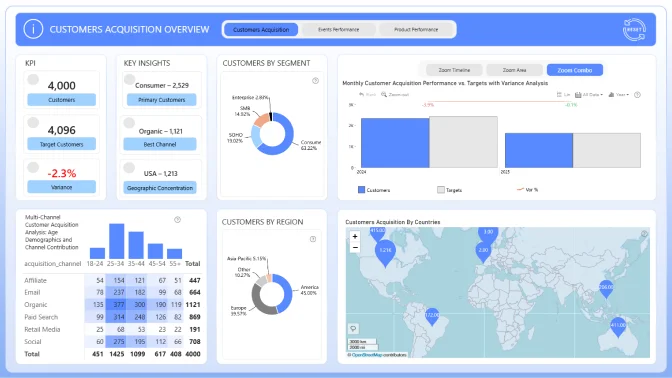
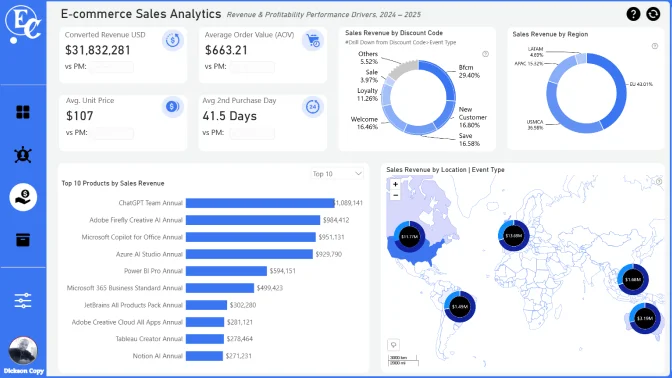
How to use a PBIX template
Preview the interactive report, download the PBIX file, open it in Power BI Desktop, and replace the same data connection with your own dataset.
Preview and download
Explore the report online and download the PBIX template file.
Open in Power BI Desktop
Open the downloaded PBIX file in Power BI Desktop.
Connect your data
Replace the sample data source with your own dataset.
Refresh and adjust
Refresh the model and update fields or visual were needed.
Save and share
Save your report and publish it for your audience.


