938
Merchandise Sales Analysis Report 2
Merchandise Sales Analysis Report 2
Report Author: Sai Krishna Tummidi
938
Share template with others
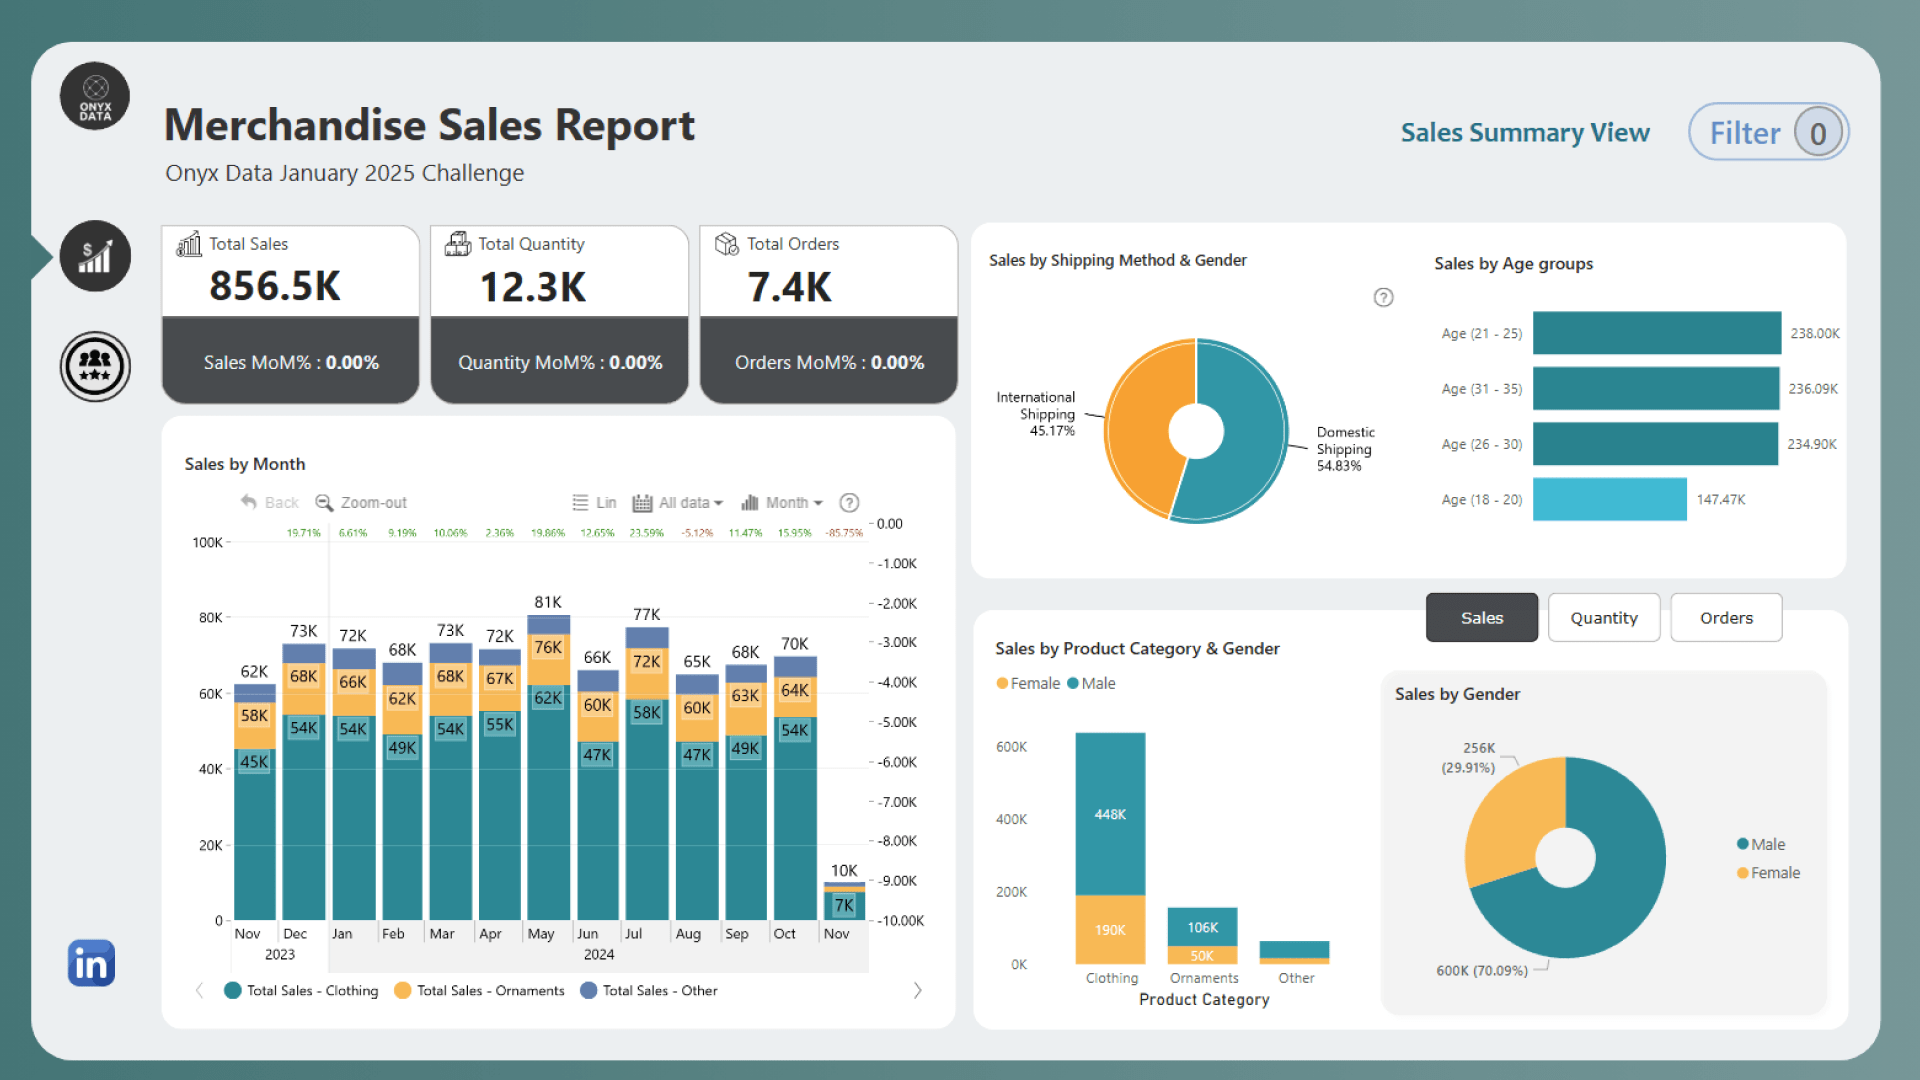
Report submitted for Onyx Data DataDNA ZoomCharts Mini Challenge, January 2025. The report is based on the Merchandise Sales dataset and includes ZoomCharts custom Drill Down PRO visuals for Power BI.
Author's description:
This Power BI project enables users to dynamically filter and visualize data using slicers for "Top/Bottom," "Breakdown" (Order Location or Product ID), and ranking. A clustered bar chart updates to display ranked data points, while a real-time dynamic title reflects the selected parameters, ensuring clarity and interactivity in data exploration.
4U Report Challenges
Participate in data challenges, build and submit reports to get free template downloads.
Join CommunityMobile view allows you to interact with the report. To Download the template please switch to desktop view.
Was this helpful? Thank you for your feedback!
Sorry about that.
How can we improve it?