574
Maverick Spend Analysis Dashboard
Maverick Spend Analysis Dashboard
More Report pages
Report Author: Lakshi Weerakkodige
574
Share template with others
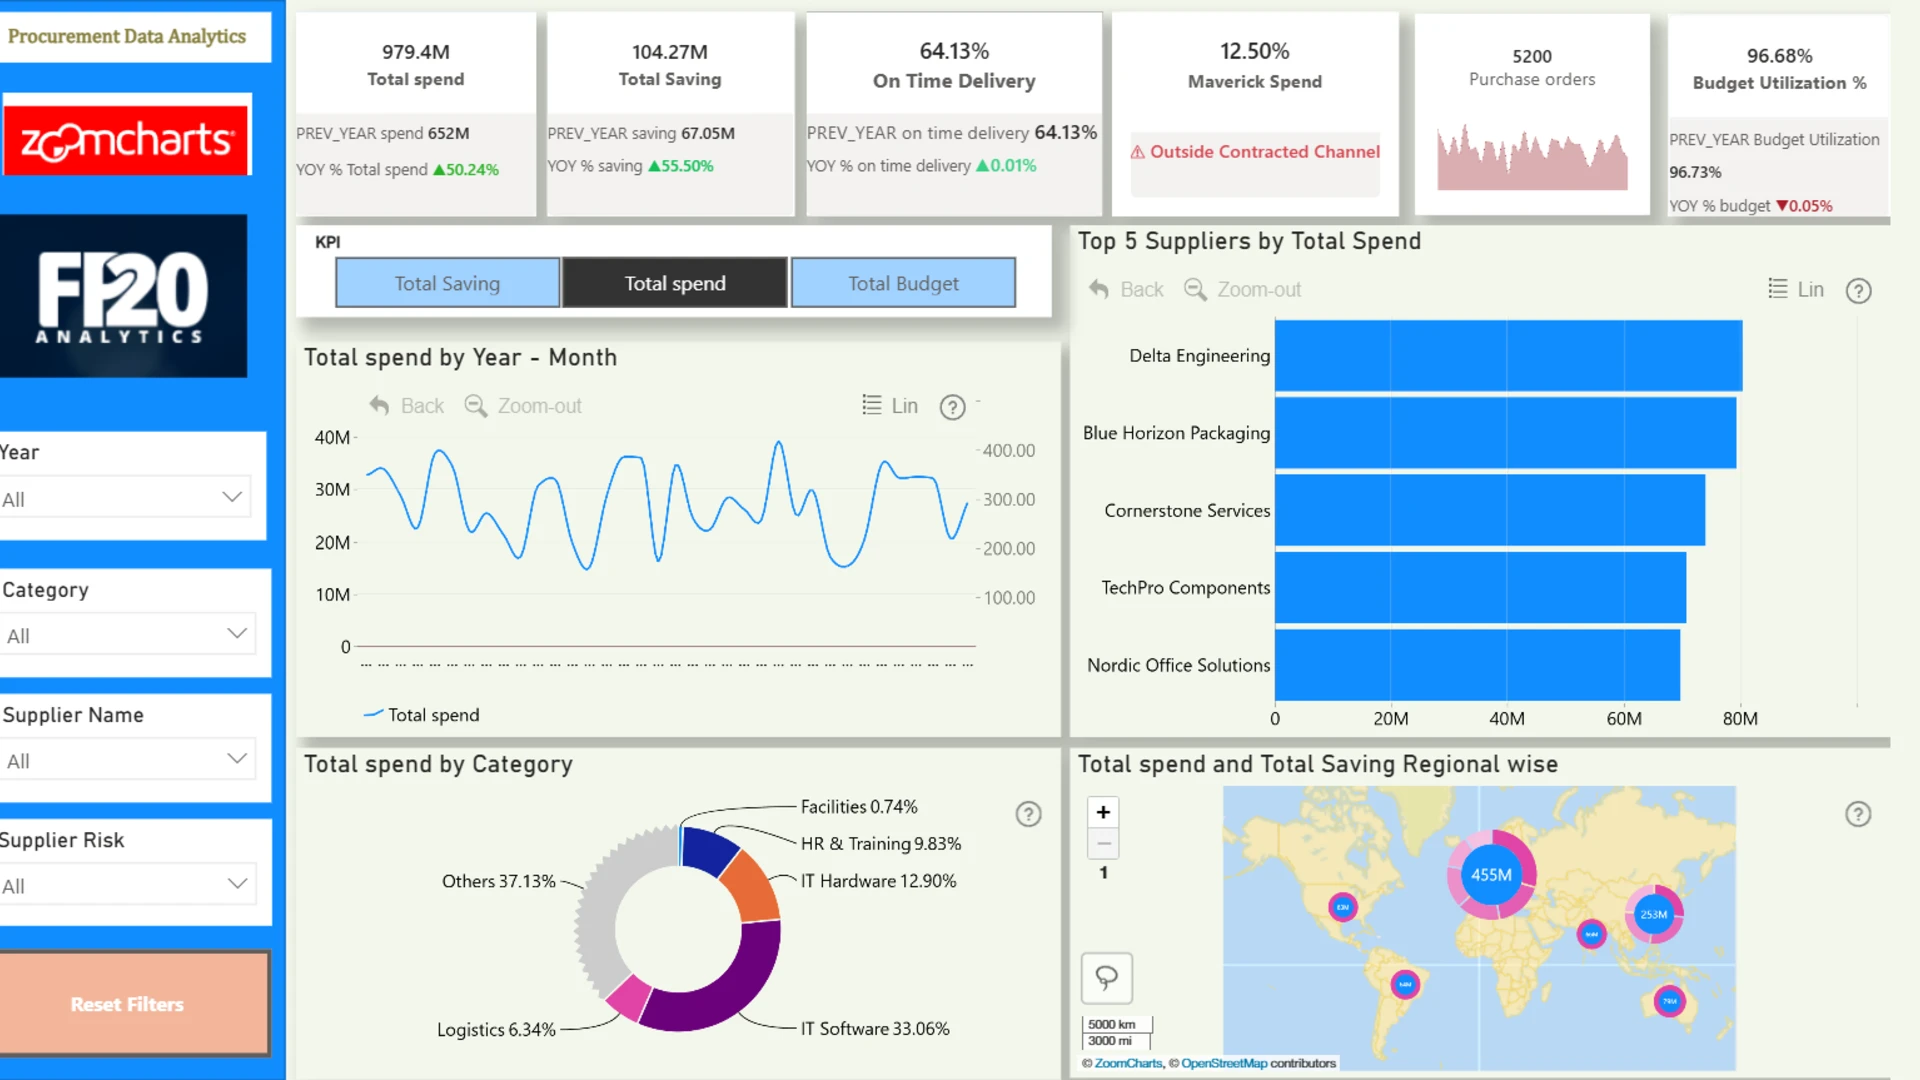
This interactive Power BI report explores the Procurement dataset using ZoomCharts Drill Down custom visuals and native Power BI visuals. It analyzes purchase order activity from 2022 to 2024, highlighting procurement spend, supplier performance, budget versus actuals, savings, delivery timelines, supplier risk, and maverick spend across categories, departments, regions, and suppliers.
The report helps users identify spending trends, compare supplier performance, monitor compliance, evaluate budget pressure, and uncover opportunities to improve procurement efficiency, reduce risk, and support better purchasing decisions.
The report was submitted to the FP20 Analytics ZoomCharts Data Challenge 37 (April-May 2026).
Author’s Description:
FP20 Analytics ZoomCharts Challenge 36, focused on Strategic Spend & Budget Intelligence for procurement analytics.
My dashboard is built across three pages:
• Executive Overview & Spend
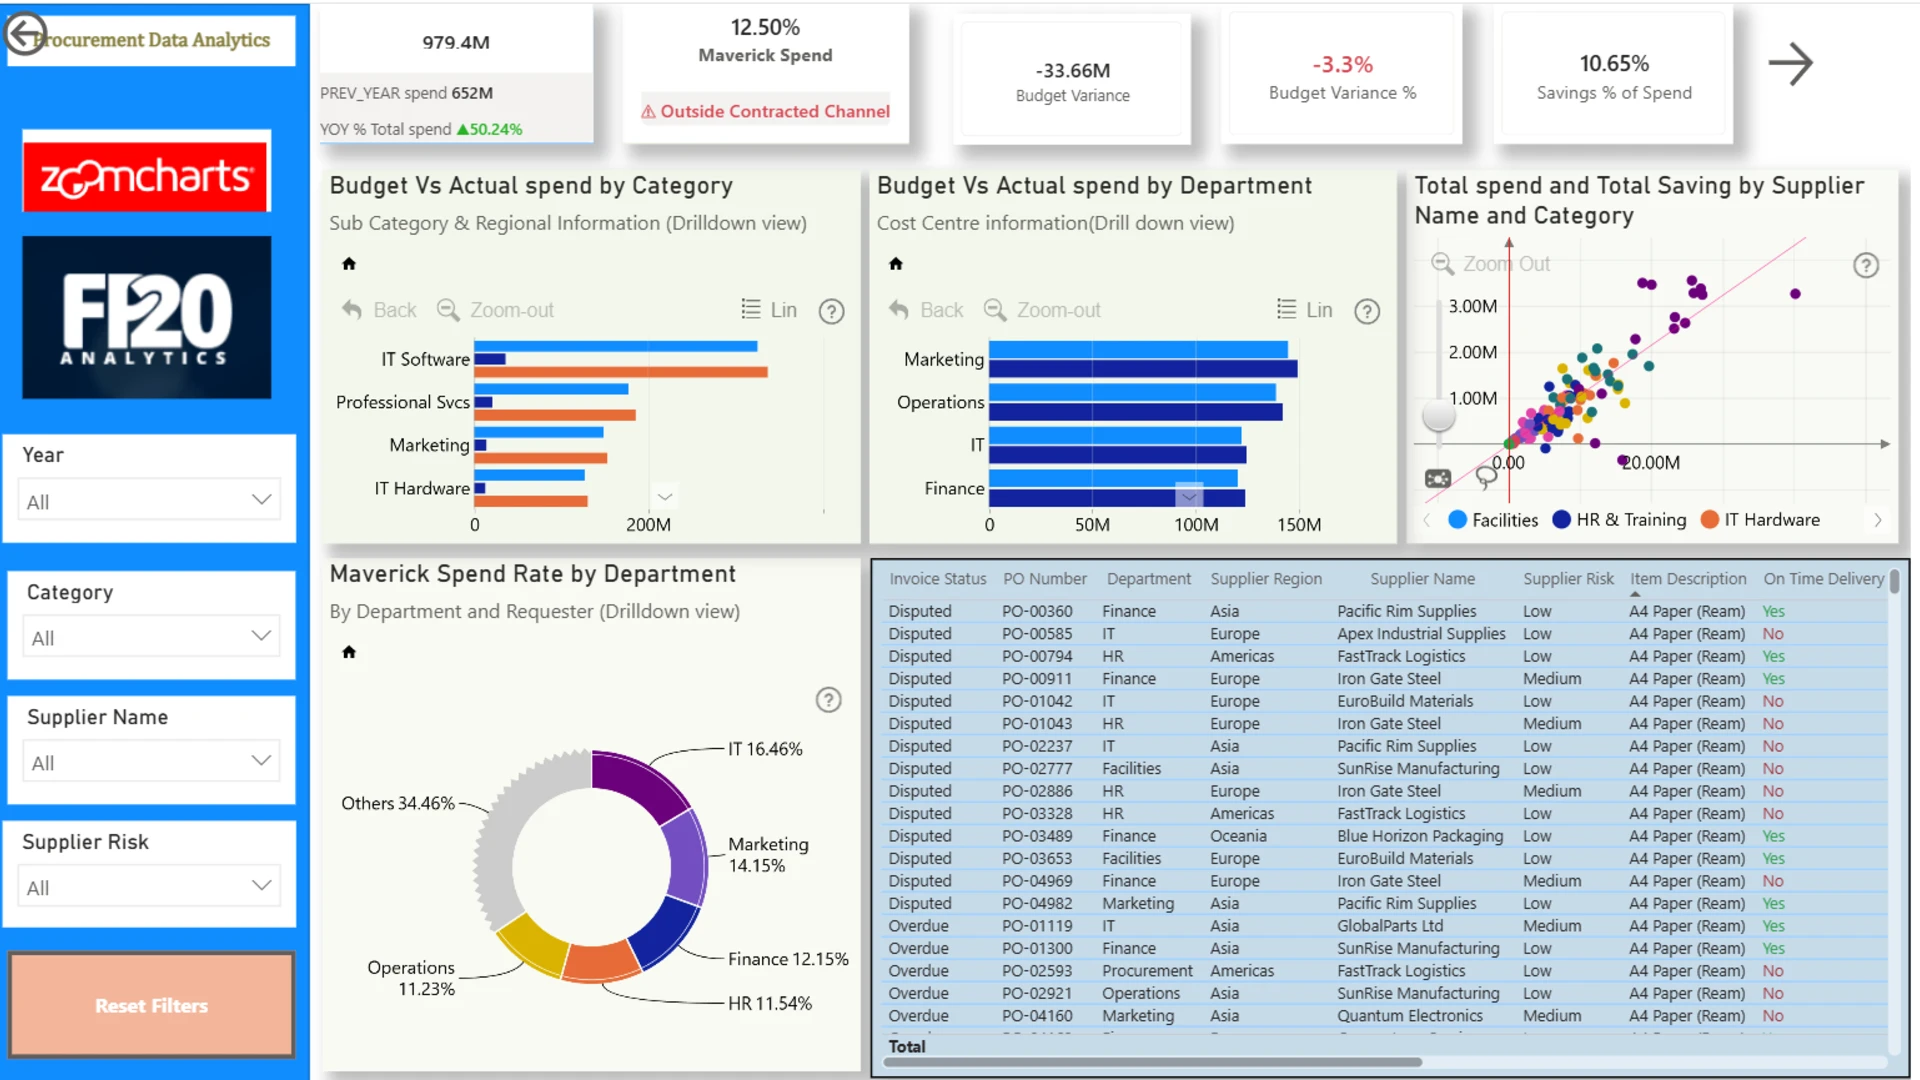
• Budget & Savings Insights
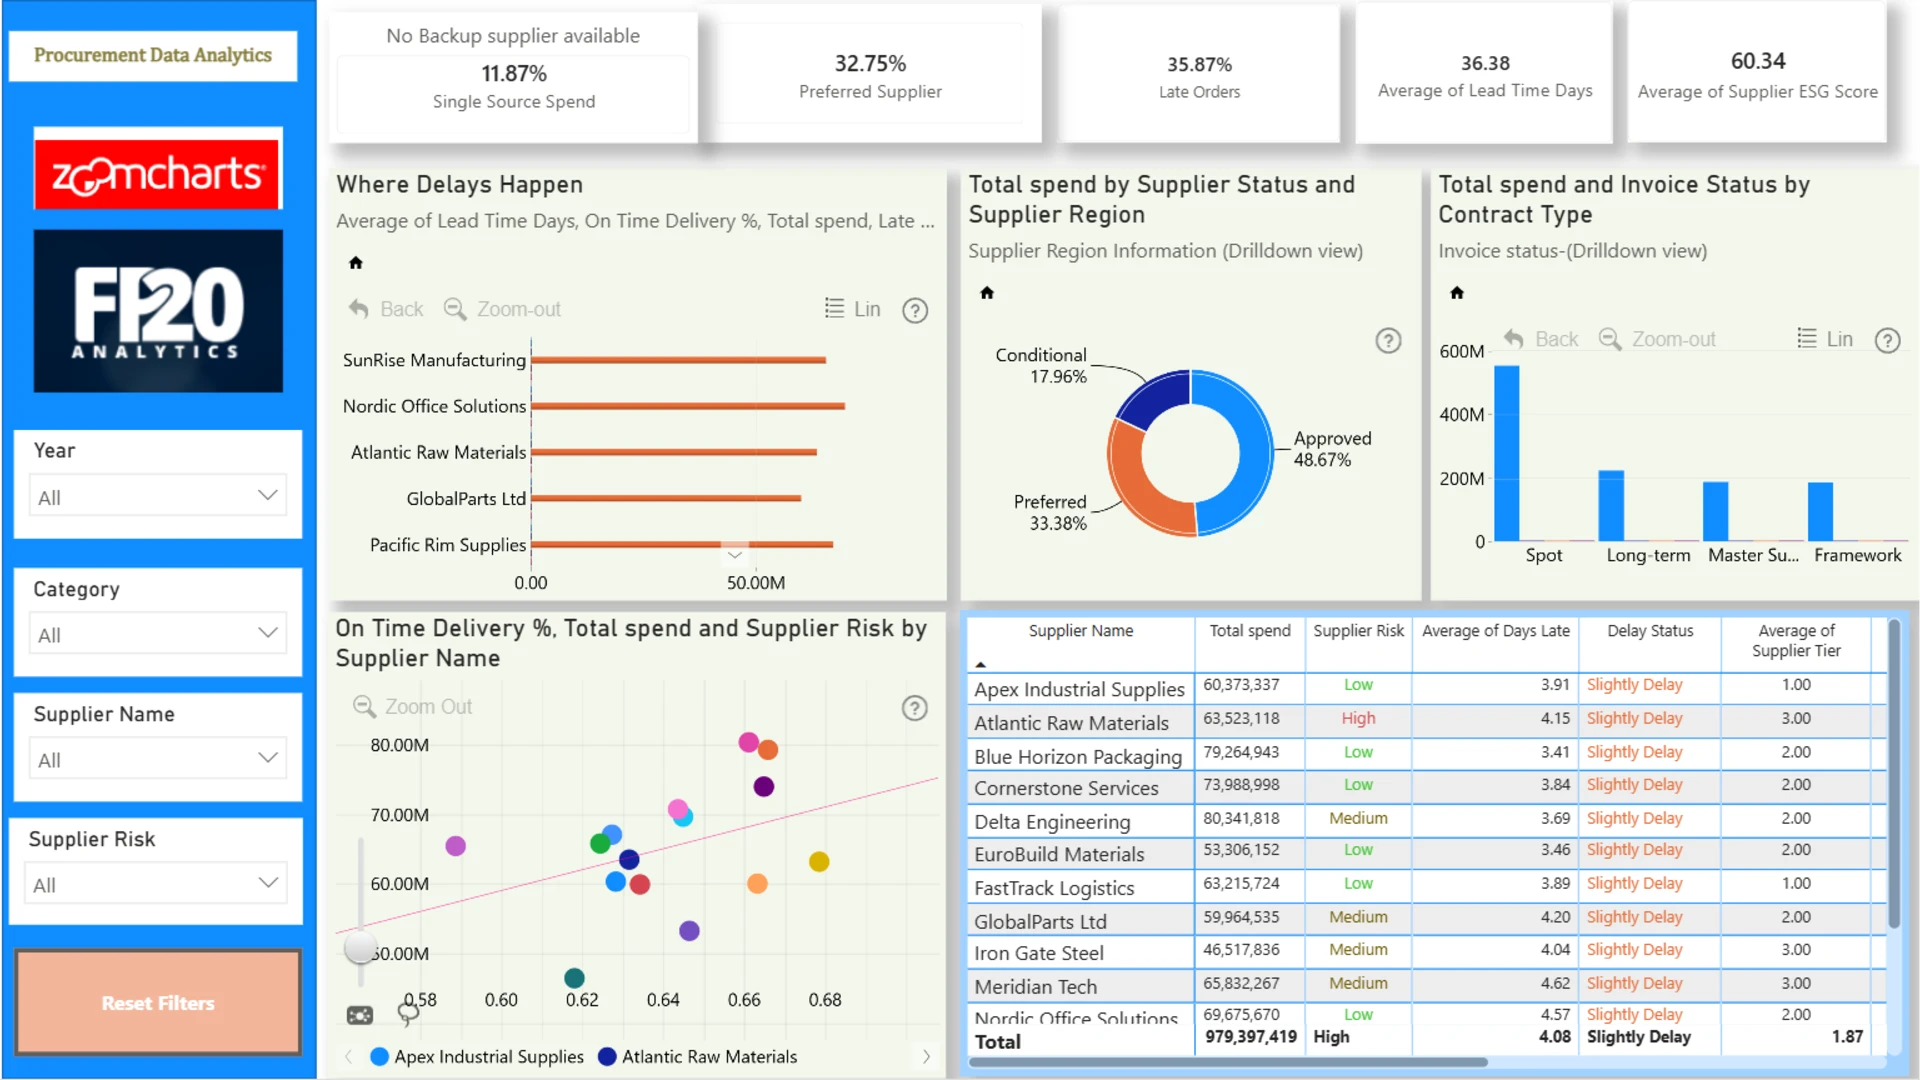
• Supplier Performance, Risk & Compliance
Key highlights from the analysis:
• Total Spend: $979.40M across 5,200 orders
• On-Time Delivery Rate: 64.13%
• Savings Rate: 10.29%
• Maverick Spend Rate: 10.76%
• Top Category: IT & Software (33.06% of total spend)
• Top Supplier: Delta Engineering, with the highest spend volume
This dashboard helps leaders understand spending behavior, track supplier performance, monitor savings, and identify compliance gaps.
ZoomCharts visuals used
4U Report Challenges
Participate in data challenges, build and submit reports to get free template downloads.
Join CommunityMobile view allows you to interact with the report. To Download the template please switch to desktop view.


Was this helpful? Thank you for your feedback!
Sorry about that.
How can we improve it?