4222
Marketing Email Campaign Report
Marketing Email Campaign Report
More Report pages
Report Author: Zakaria Fadili
4222
Share template with others
Report submitted for the FP20 Analytics ZoomCharts Challenge, October 2024. The report was built using the Marketing Email Campaign performance dataset and includes ZoomCharts custom Drill Down PRO visuals for Power BI.
Author's Description:
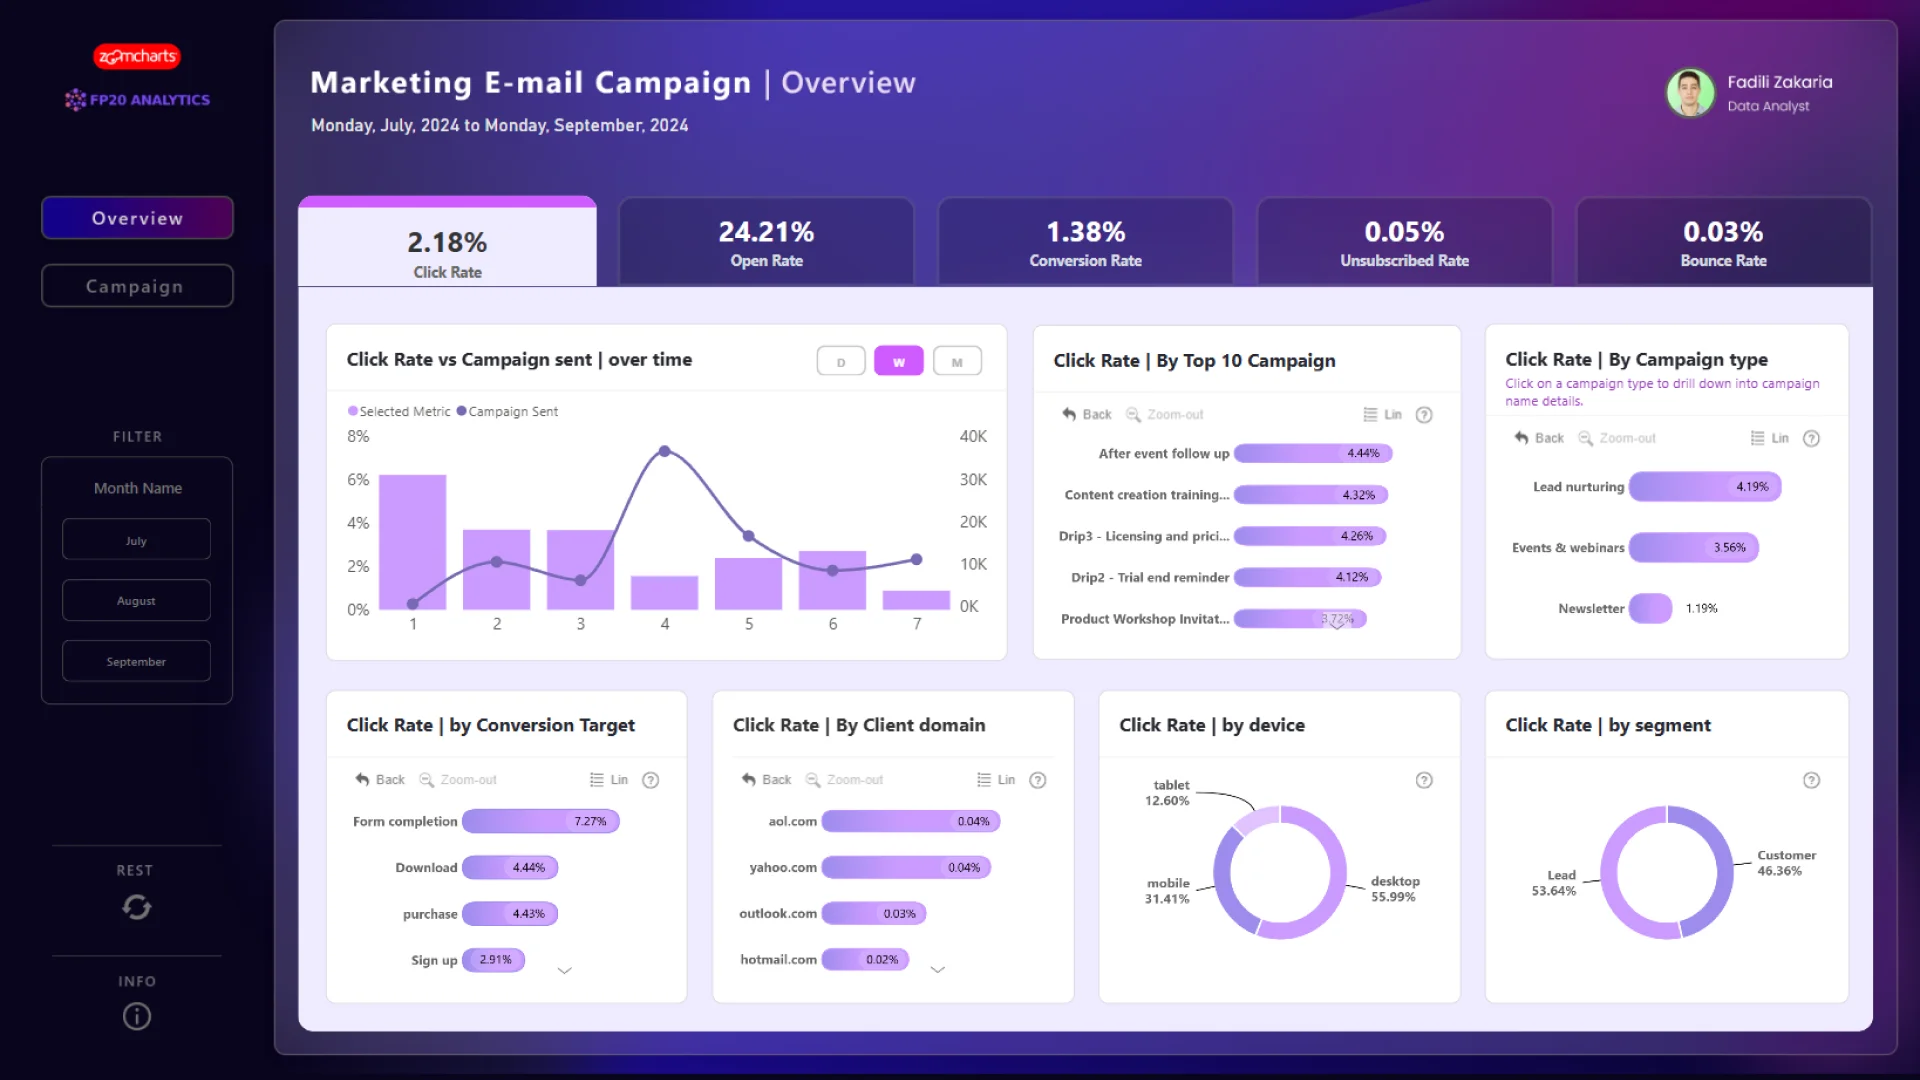
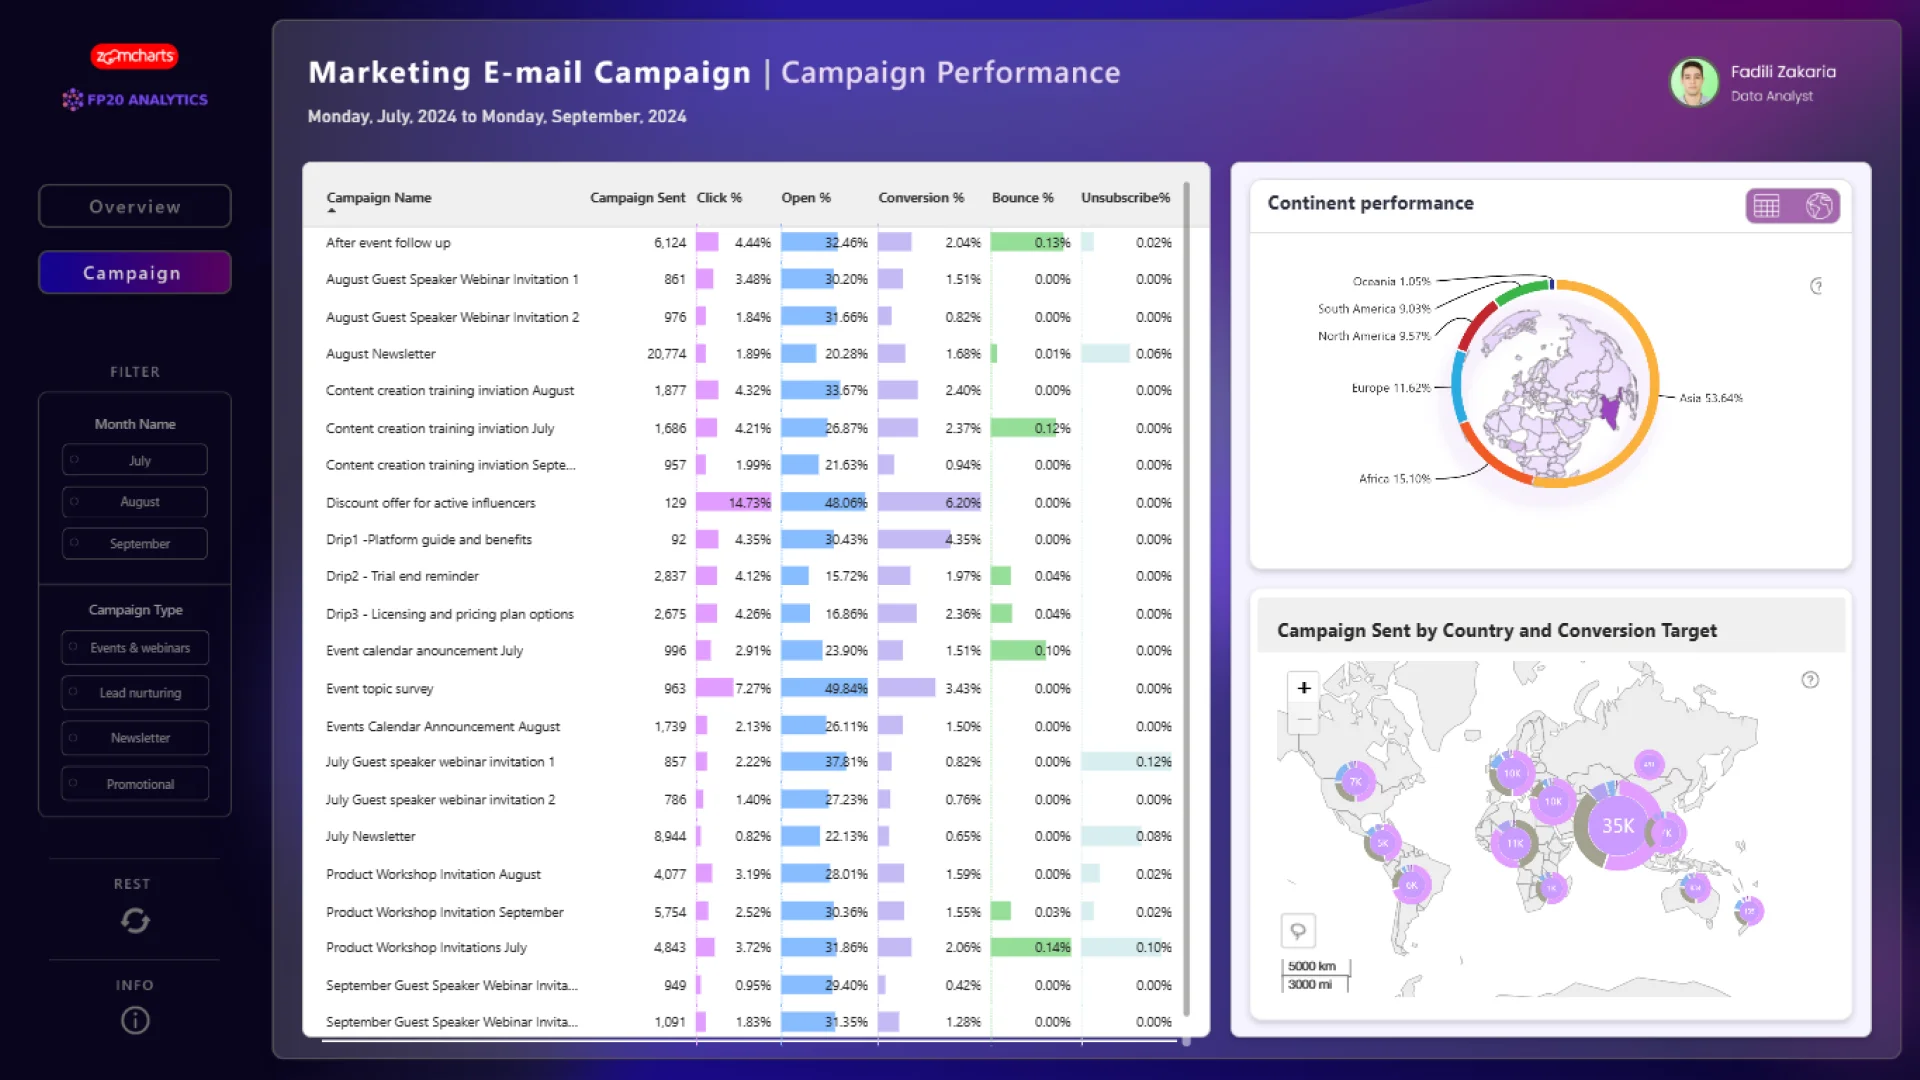
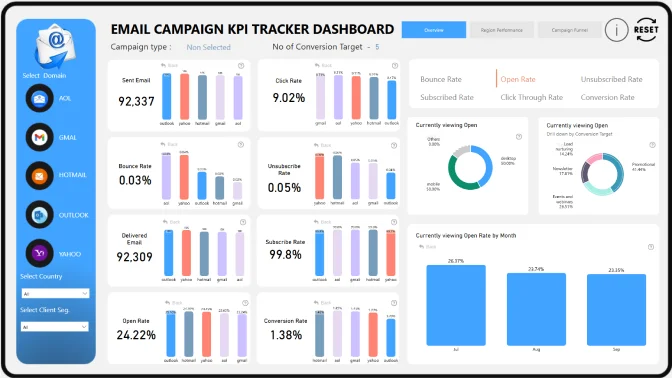
This report analyzes the performance of email campaigns from July to September 2024 for a niche content platform focused on DIY creators and readers. It provides insights into audience engagement, conversion drivers, and geographic trends, enabling the marketing team to optimize their email outreach strategy.
Report Structure:
Overview Page:
Provides a high-level summary of key metrics, including Click Rate, Open Rate, Conversion Rate, Unsubscribe Rate, and Bounce Rate. Interactive slicers allow users to focus on specific metrics, updating all visuals accordingly. Visualizations highlight campaign trends over time, the top 10 campaigns, and performance by campaign type. Additional breakdowns include conversion targets, client domains, device usage, and audience segments.
Campaign Performance Page:
Offers a detailed view of individual campaign metrics, such as the number of emails sent, click rate, open rate, conversion rate, bounce rate, and unsubscribe rate. Regional performance is visualized through a donut chart for continent-level engagement and a world map that displays campaigns by country and conversion target, revealing global audience interactions.



4U Report Challenges
Participate in data challenges, build and submit reports to get free template downloads.
Join CommunityMobile view allows you to interact with the report. To Download the template please switch to desktop view.
How to use a PBIX template
Preview the interactive report, download the PBIX file, open it in Power BI Desktop, and replace the same data connection with your own dataset.
Preview and download
Explore the report online and download the PBIX template file.
Open in Power BI Desktop
Open the downloaded PBIX file in Power BI Desktop.
Connect your data
Replace the sample data source with your own dataset.
Refresh and adjust
Refresh the model and update fields or visual were needed.
Save and share
Save your report and publish it for your audience.


