10257
Power BI Logistics Delivery & Vehicle Utilization Dashboard
Power BI Logistics Delivery & Vehicle Utilization Dashboard
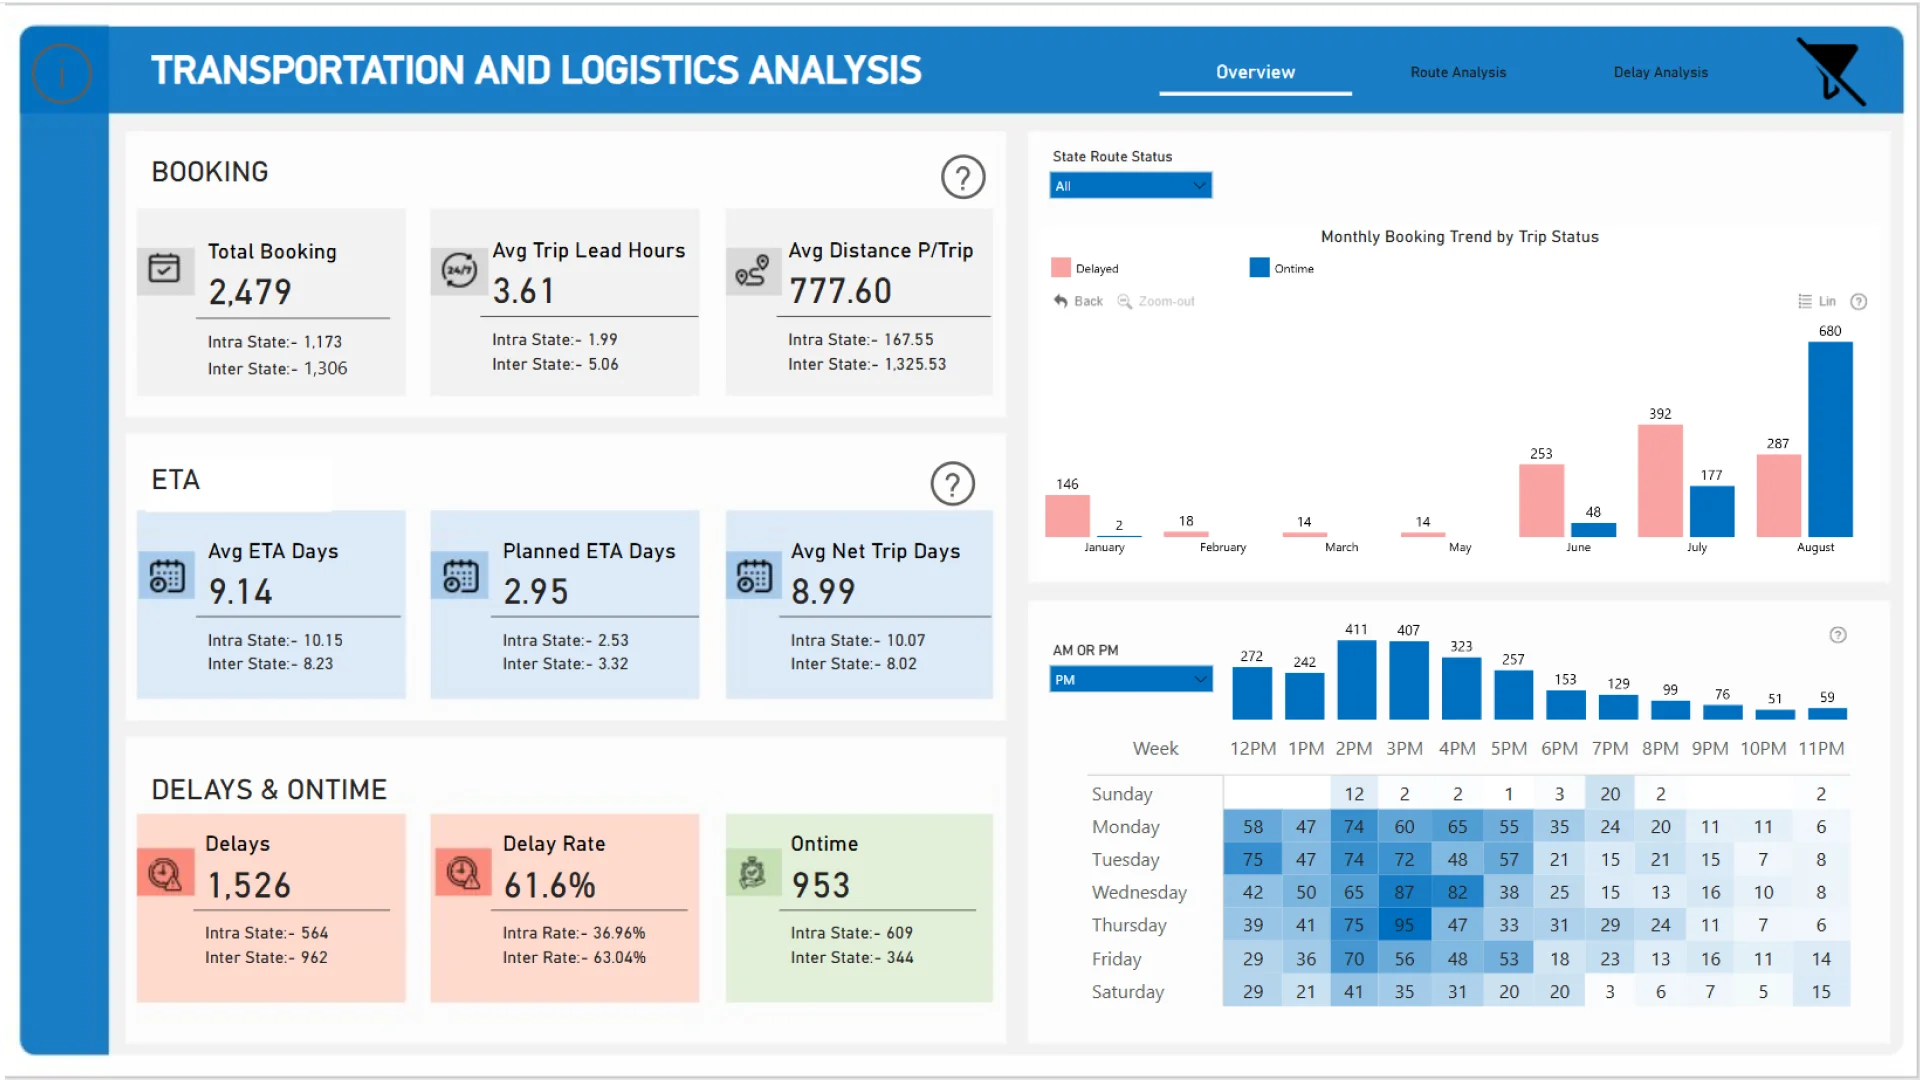
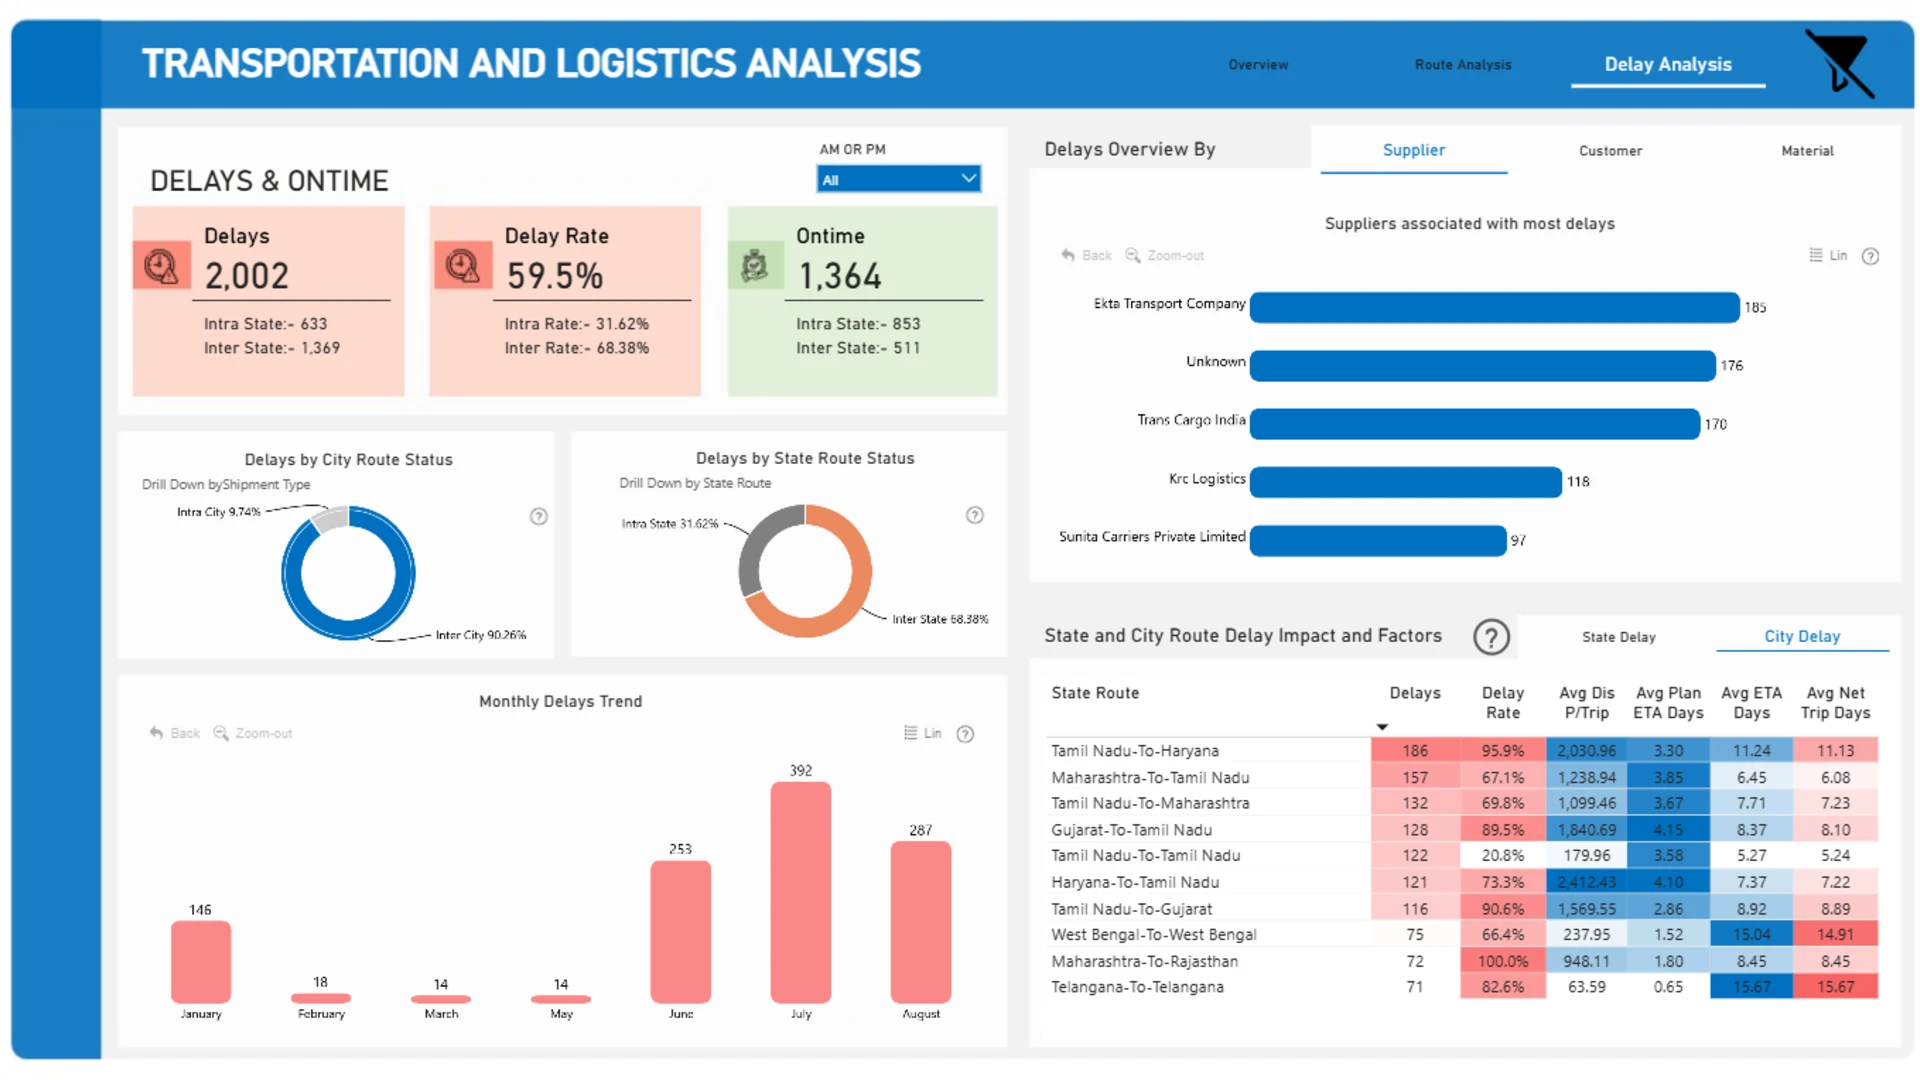
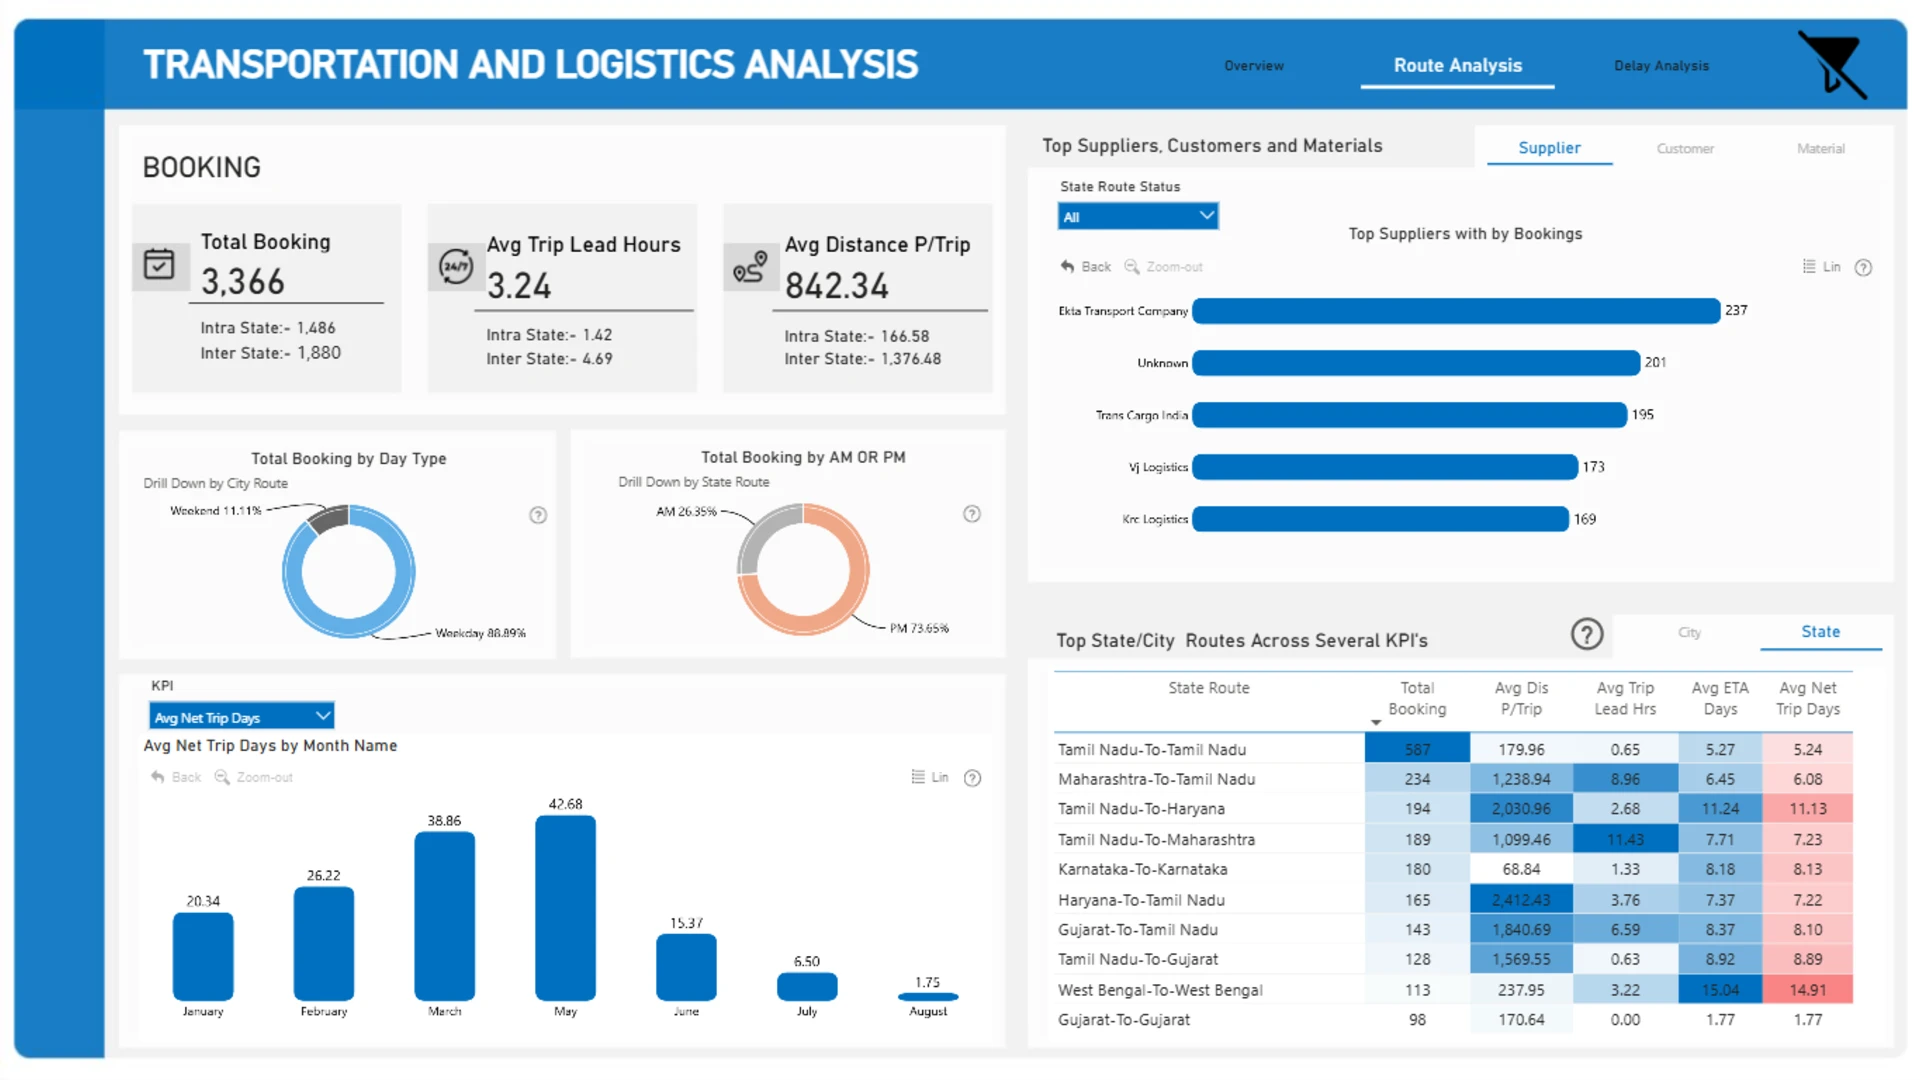
More Report pages
Report Author: Okeh Dono Efasa
10257
Share template with others
Summary
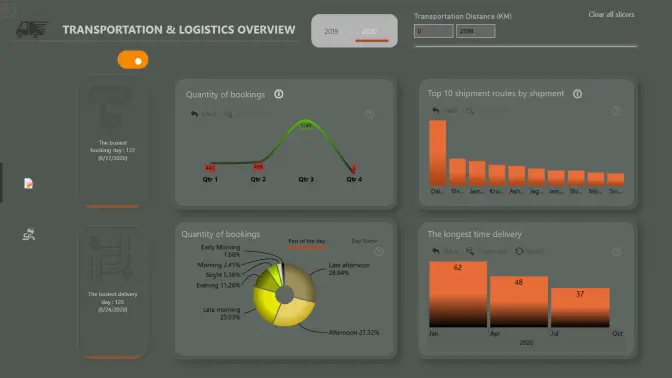
This Power BI logistics dashboard analyzes delivery delays, booking activity, supplier performance, routes, and vehicle utilization. It was created by Okeh Dono Efasa for the February 2025 FP20 Analytics ZoomCharts Challenge using the Transportation & Logistics Dataset.
The report helps users investigate where delivery problems occur and examine how booking volumes, supplier concentration, shipment processing, routes, and vehicle usage relate to logistics performance.
Key Insights of the Power BI Logistics Delivery & Vehicle Utilization Dashboard
The report approaches transportation performance from several operational perspectives. Its main findings include:
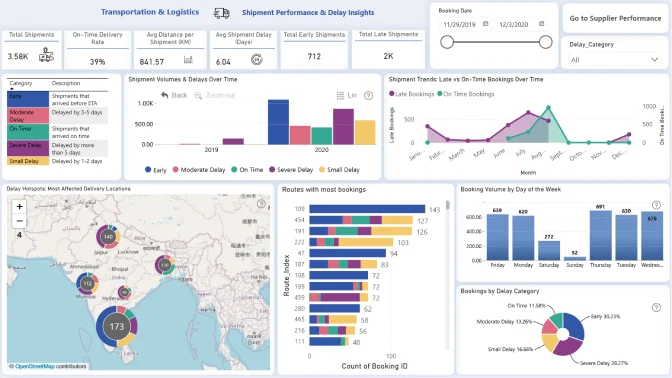
- Late deliveries: approximately 58% of total bookings were delivered late
- Booking trends: booking activity remained low until May 2020, after which bookings and late deliveries increased
- Supplier concentration: around 19% of suppliers handled 80% of bookings
- Shipment processing: 96% of shipments were processed within 24 hours
- Vehicle utilization: approximately 90% of vehicles were identified as either underutilized or overutilized
Drill Down Combo, Combo Bar, and Donut visuals support interactive analysis of trends and categorical breakdowns. Users can move from the overall logistics picture to more detailed views of bookings, suppliers, routes, and vehicle usage.
How to Use This Power BI Logistics Delivery & Vehicle Utilization Dashboard
Click active chart elements to filter the report or drill into a specific period, supplier, route, booking category, or vehicle segment. Compare the different views to investigate the factors associated with delivery delays and inefficient vehicle utilization.
Download the PBIX template to explore the data model, calculations, and visual settings in Power BI Desktop. Connect the report to your own transportation data and adjust its fields, measures, and categories as needed.



4U Report Challenges
Participate in data challenges, build and submit reports to get free template downloads.
Join CommunityMobile view allows you to interact with the report. To Download the template please switch to desktop view.
How to use a PBIX template
Preview the interactive report, download the PBIX file, open it in Power BI Desktop, and replace the same data connection with your own dataset.
Preview and download
Explore the report online and download the PBIX template file.
Open in Power BI Desktop
Open the downloaded PBIX file in Power BI Desktop.
Connect your data
Replace the sample data source with your own dataset.
Refresh and adjust
Refresh the model and update fields or visual were needed.
Save and share
Save your report and publish it for your audience.


