732
Logistics and Transportation Analysis 2
Logistics and Transportation Analysis 2
Report Author: Sushree Jena
732
Share template with others
Report submitted for the FP20 Analytics ZoomCharts Challenge, February-March 2025. The report was built using the Transportation & Logistics Dataset and includes ZoomCharts custom Drill Down PRO visuals for Power BI.
Author's Description:
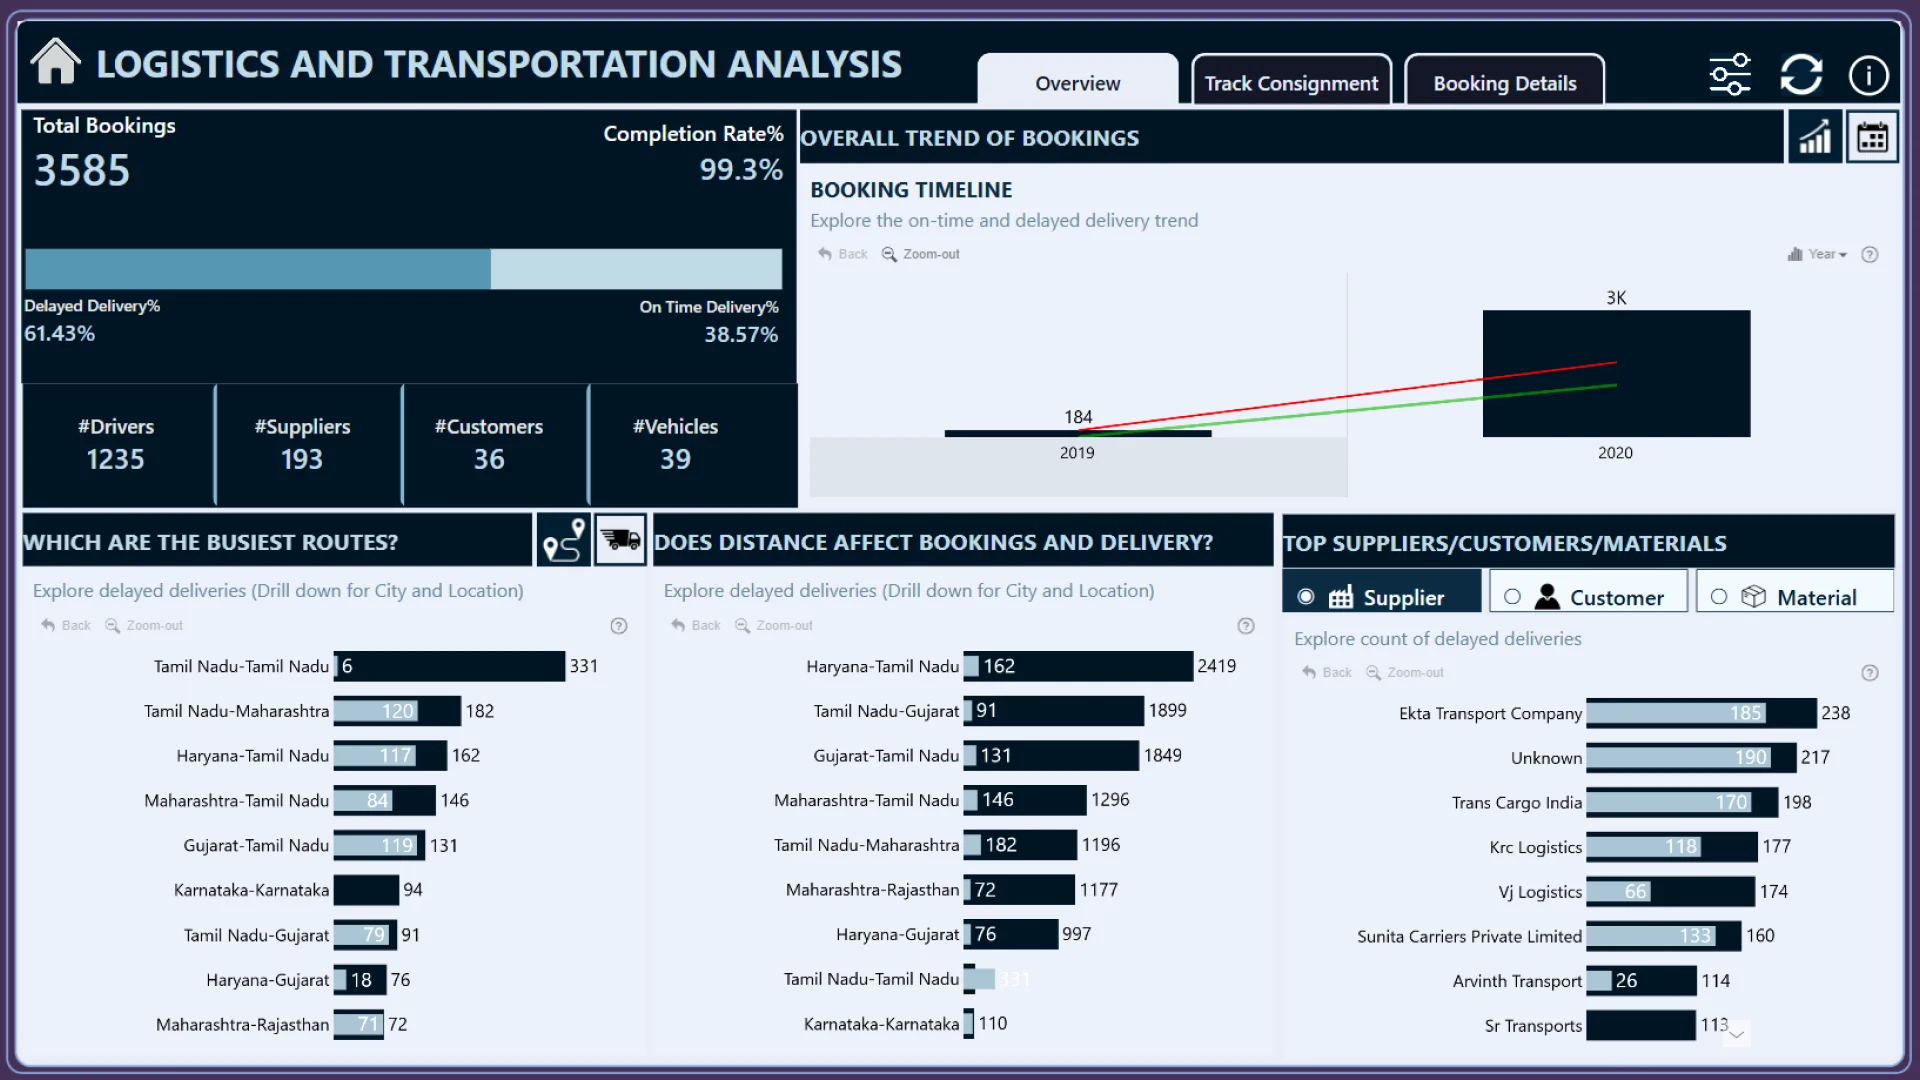
The Logistics and Transportation Analysis Dashboard offers a detailed overview of bookings and deliveries. It enables users to efficiently track consignments, monitor driver details, and predict delivery times(hours) based on selected parameters. By providing insights into delays and the factors contributing to them, the dashboard serves as a valuable tool for identifying inefficiencies in the delivery process and addressing gaps in the pipeline, ultimately improving overall operational performance.
4U Report Challenges
Participate in data challenges, build and submit reports to get free template downloads.
Join CommunityMobile view allows you to interact with the report. To Download the template please switch to desktop view.
Was this helpful? Thank you for your feedback!
Sorry about that.
How can we improve it?