1105
Power BI IT Support Helpdesk Dashboard Example
Power BI IT Support Helpdesk Dashboard Example
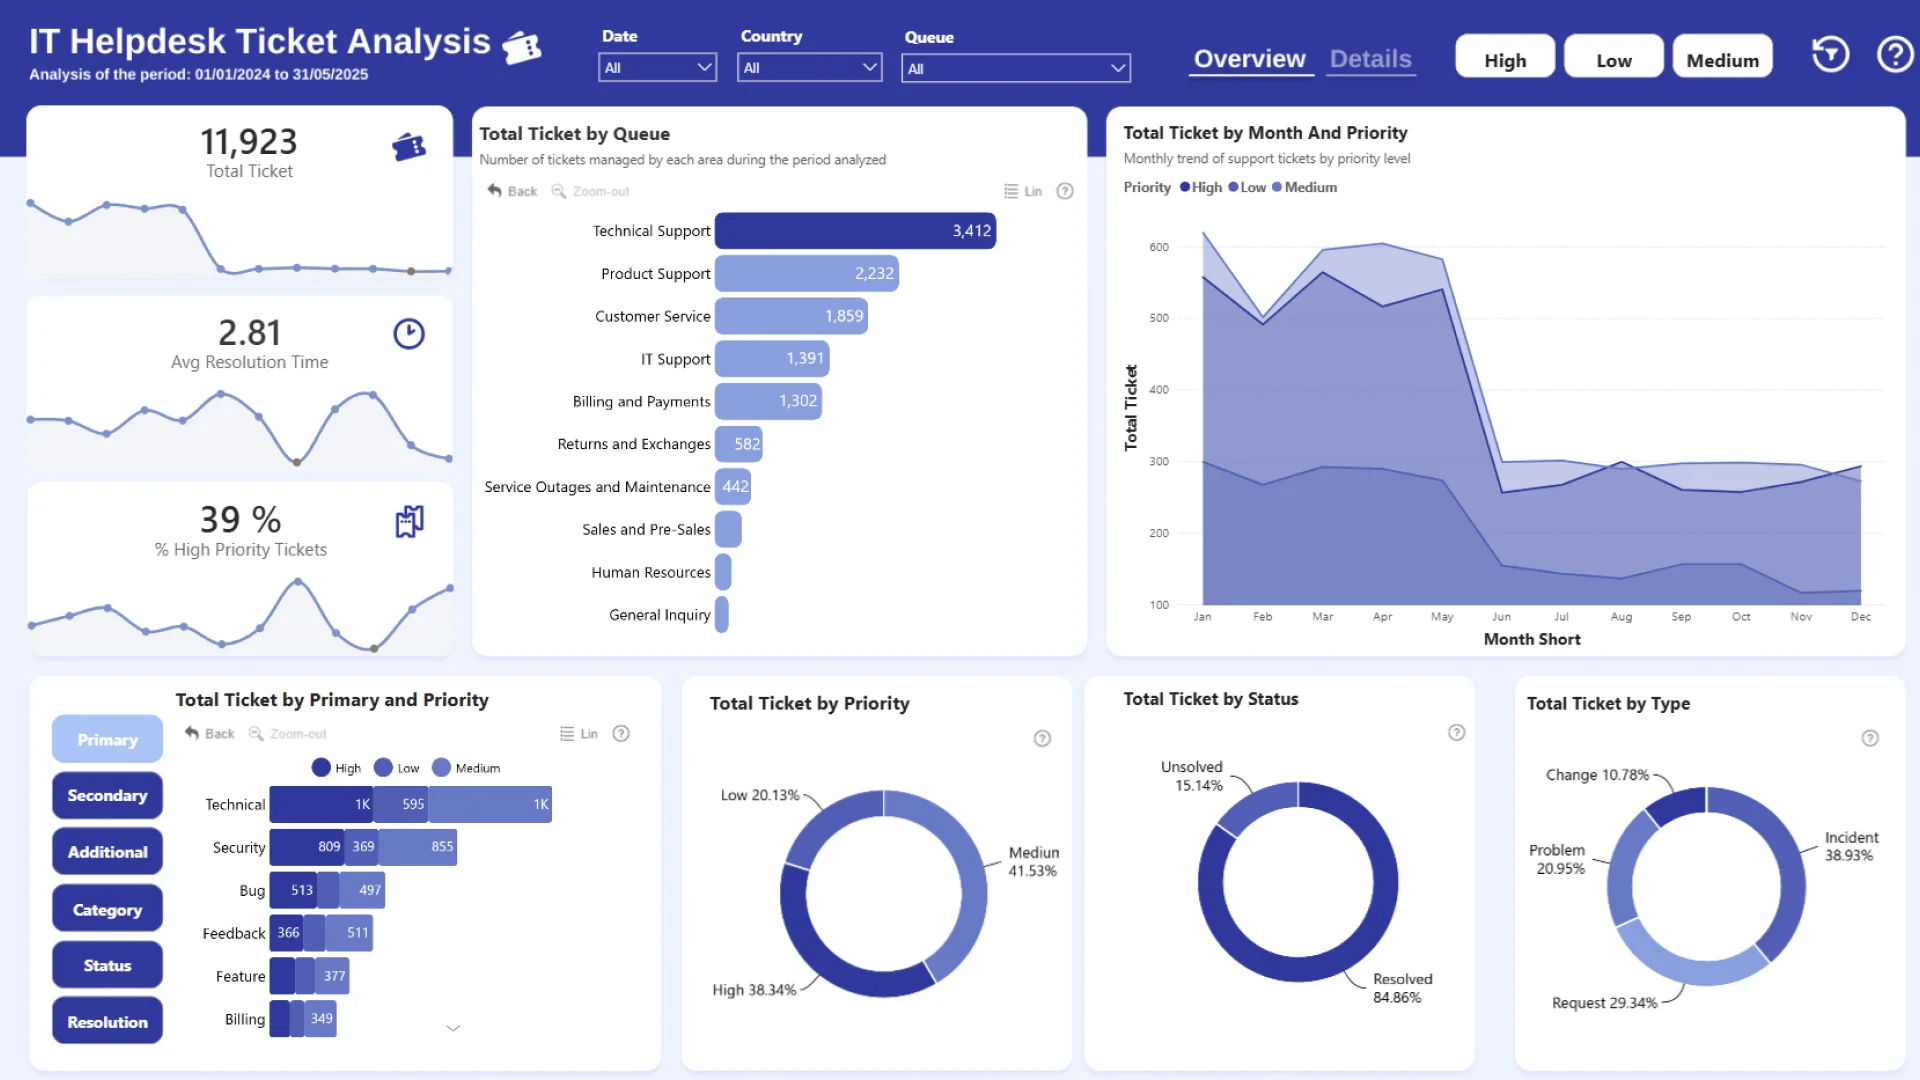
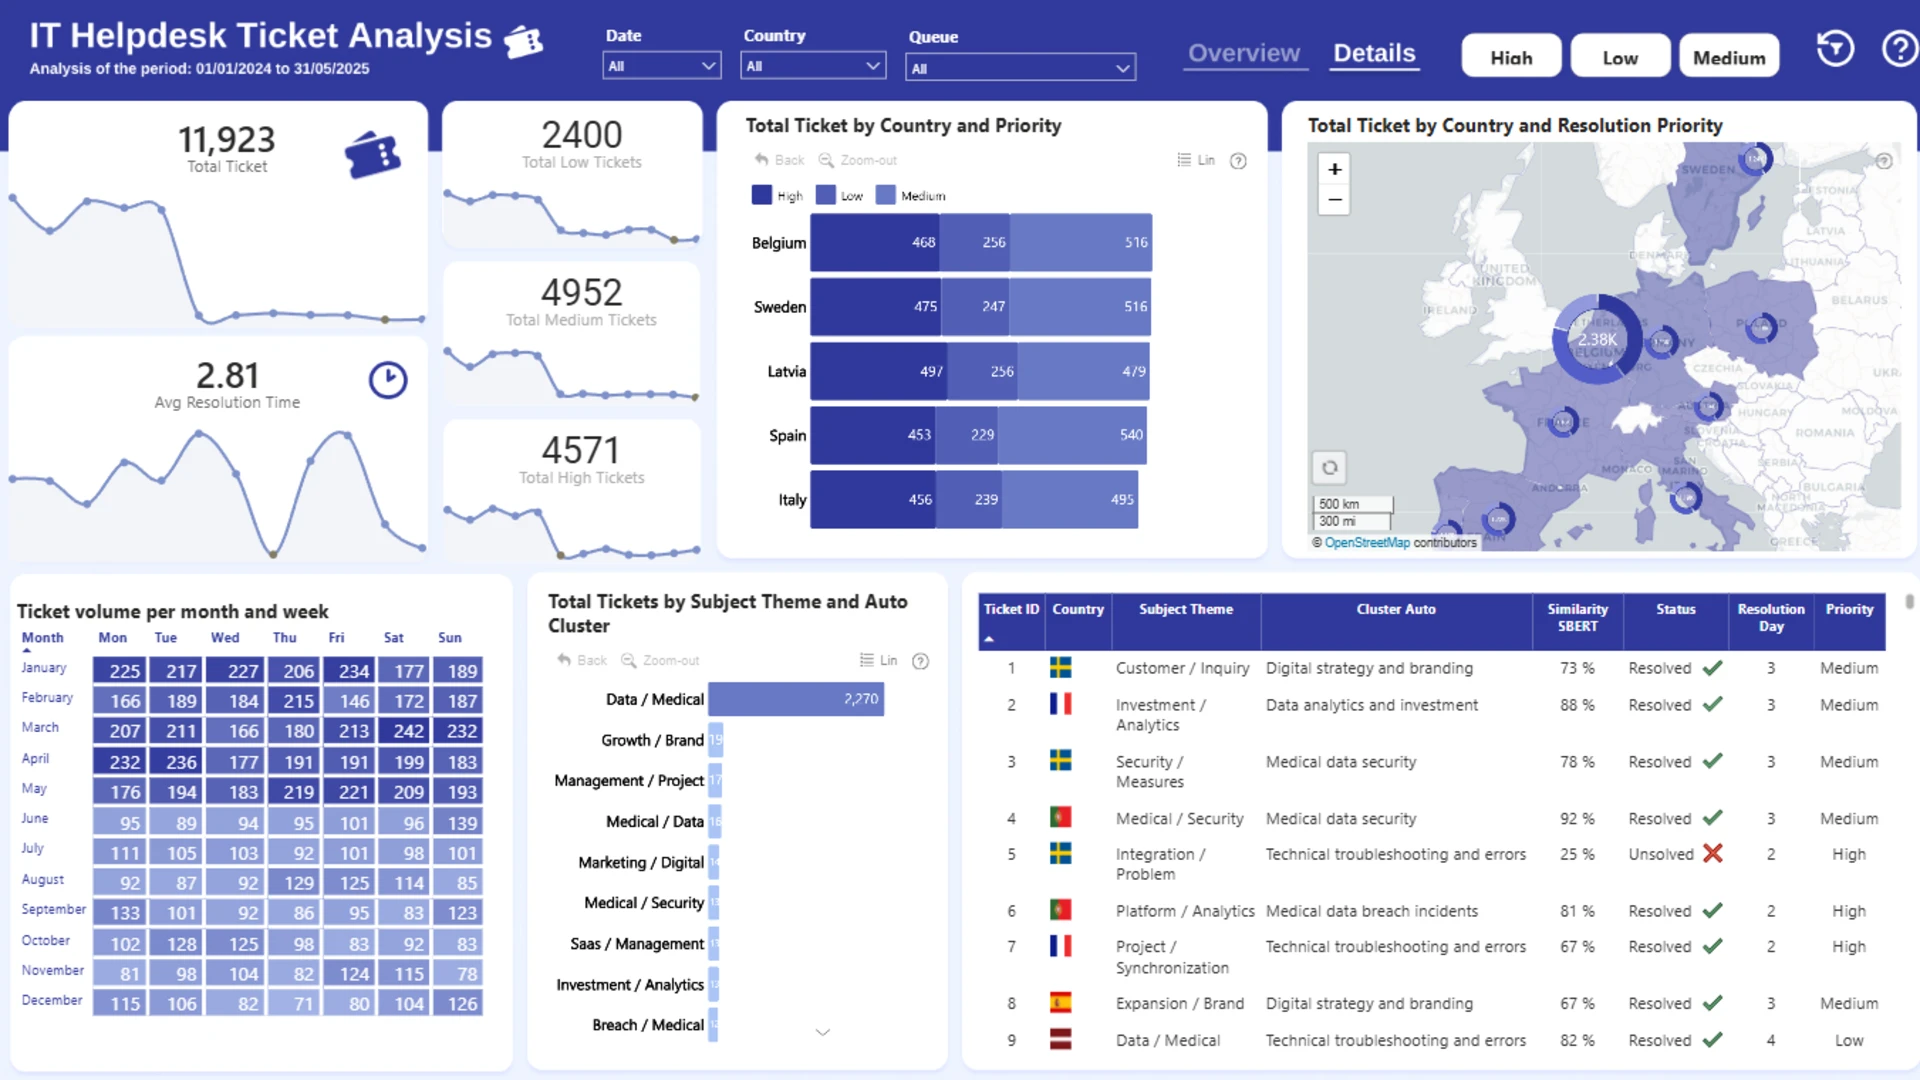
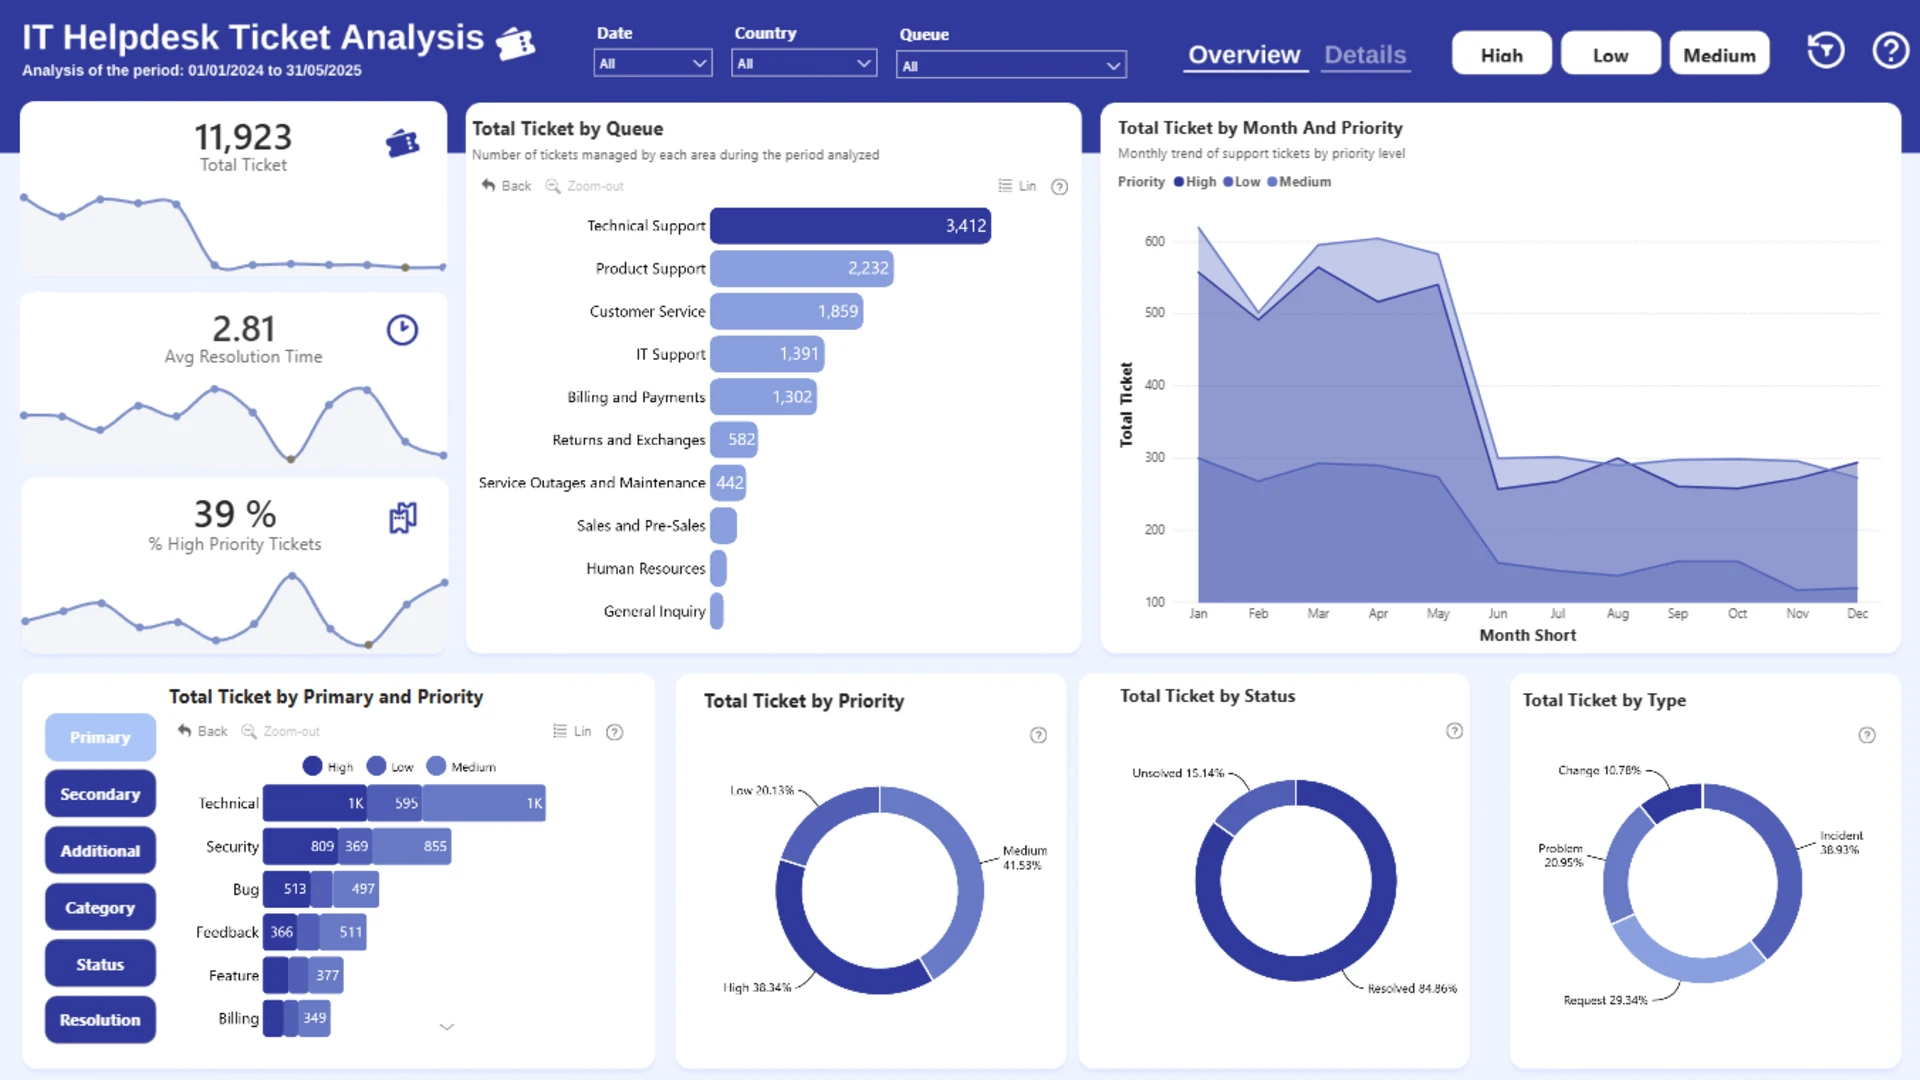
More Report pages
Report Author: Maura Galindo
1105
Share template with others
Summary
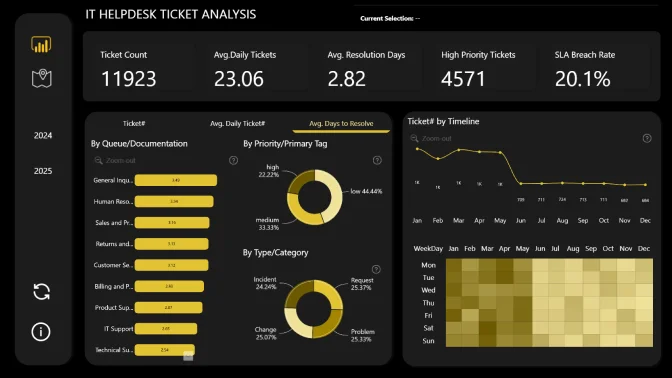
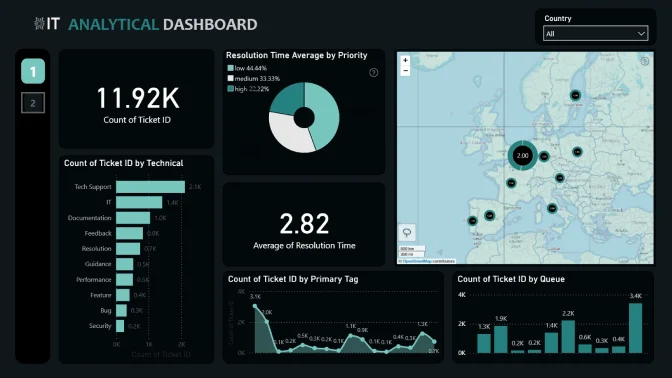
The report makes it easier to monitor IT support performance, helpdesk workload, and service efficiency in one place. With clear visualizations and interactive filtering, users can explore support activity, compare performance across different dimensions, and identify trends that may affect response quality, workload distribution, and overall helpdesk effectiveness.
What can you do with this report?
With this Power BI IT support helpdesk dashboard, you can:
- Monitor overall helpdesk performance and ticket activity
- Track support workload trends over time
- Compare ticket patterns across different categories and locations
- Analyze how support demand is distributed across the helpdesk
- Identify recurring issues and high-volume support areas
- Explore regional and operational differences in helpdesk activity
- Use interactive visuals to filter and cross-analyze report data
- Drill down into support data for more detailed performance review
- Spot trends that may help improve team efficiency and service delivery
- Support data-driven decisions for helpdesk planning and optimization
Key insights included
This report provides an overview of IT helpdesk activity and performance, including:
- Helpdesk workload and ticket volume patterns
- Support trends over time
- Category-level and location-based comparisons
- Operational performance across different segments
- Interactive filtering for deeper report exploration
- Visual analysis of helpdesk data using Power BI custom visuals
Who is this report for?
This Power BI IT support helpdesk report is useful for:
- IT support managers
- Helpdesk team leads
- Service desk managers
- Operations managers
- Business analysts and BI teams
- Organizations monitoring internal IT support performance
Why use this Power BI IT support helpdesk dashboard?
Managing IT support operations requires clear visibility into workload, service patterns, and performance drivers. This report helps teams centralize helpdesk data, review support activity more efficiently, and uncover trends that can support better operational decisions.
Using interactive Power BI visuals, users can quickly explore the data, compare different segments, and identify areas where helpdesk processes, resource allocation, or service performance may be improved.



4U Report Challenges
Participate in data challenges, build and submit reports to get free template downloads.
Join CommunityMobile view allows you to interact with the report. To Download the template please switch to desktop view.
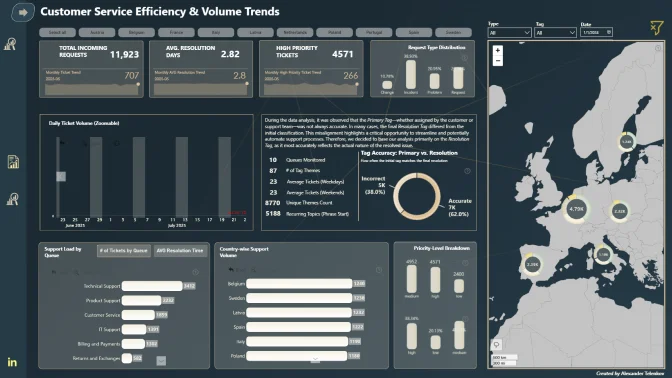
How to use a PBIX template
Preview the interactive report, download the PBIX file, open it in Power BI Desktop, and replace the same data connection with your own dataset.
Preview and download
Explore the report online and download the PBIX template file.
Open in Power BI Desktop
Open the downloaded PBIX file in Power BI Desktop.
Connect your data
Replace the sample data source with your own dataset.
Refresh and adjust
Refresh the model and update fields or visual were needed.
Save and share
Save your report and publish it for your audience.


