3919
Inventory Management Power BI Dashboard Example
Inventory Management Power BI Dashboard Example

More Report pages
Report Author: Okeh Dono Efasa
3919
Share template with others
Summary
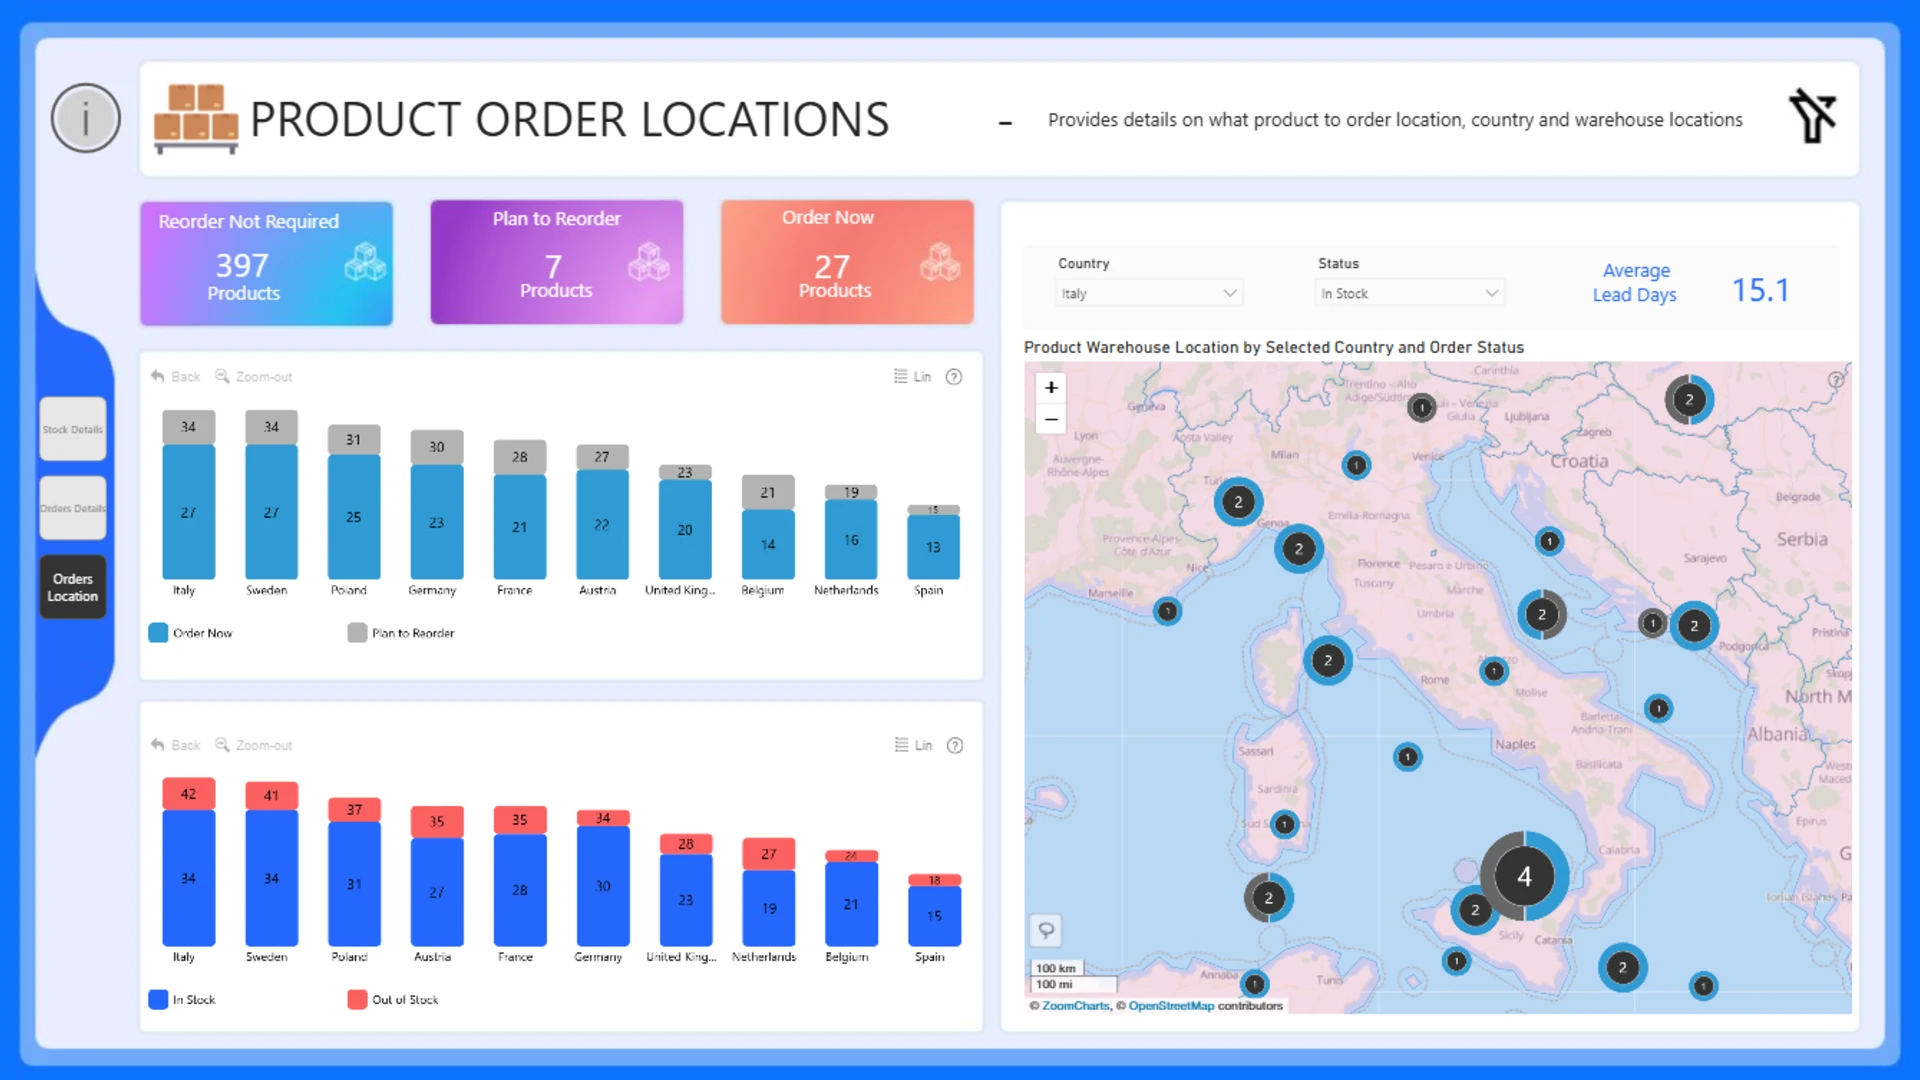
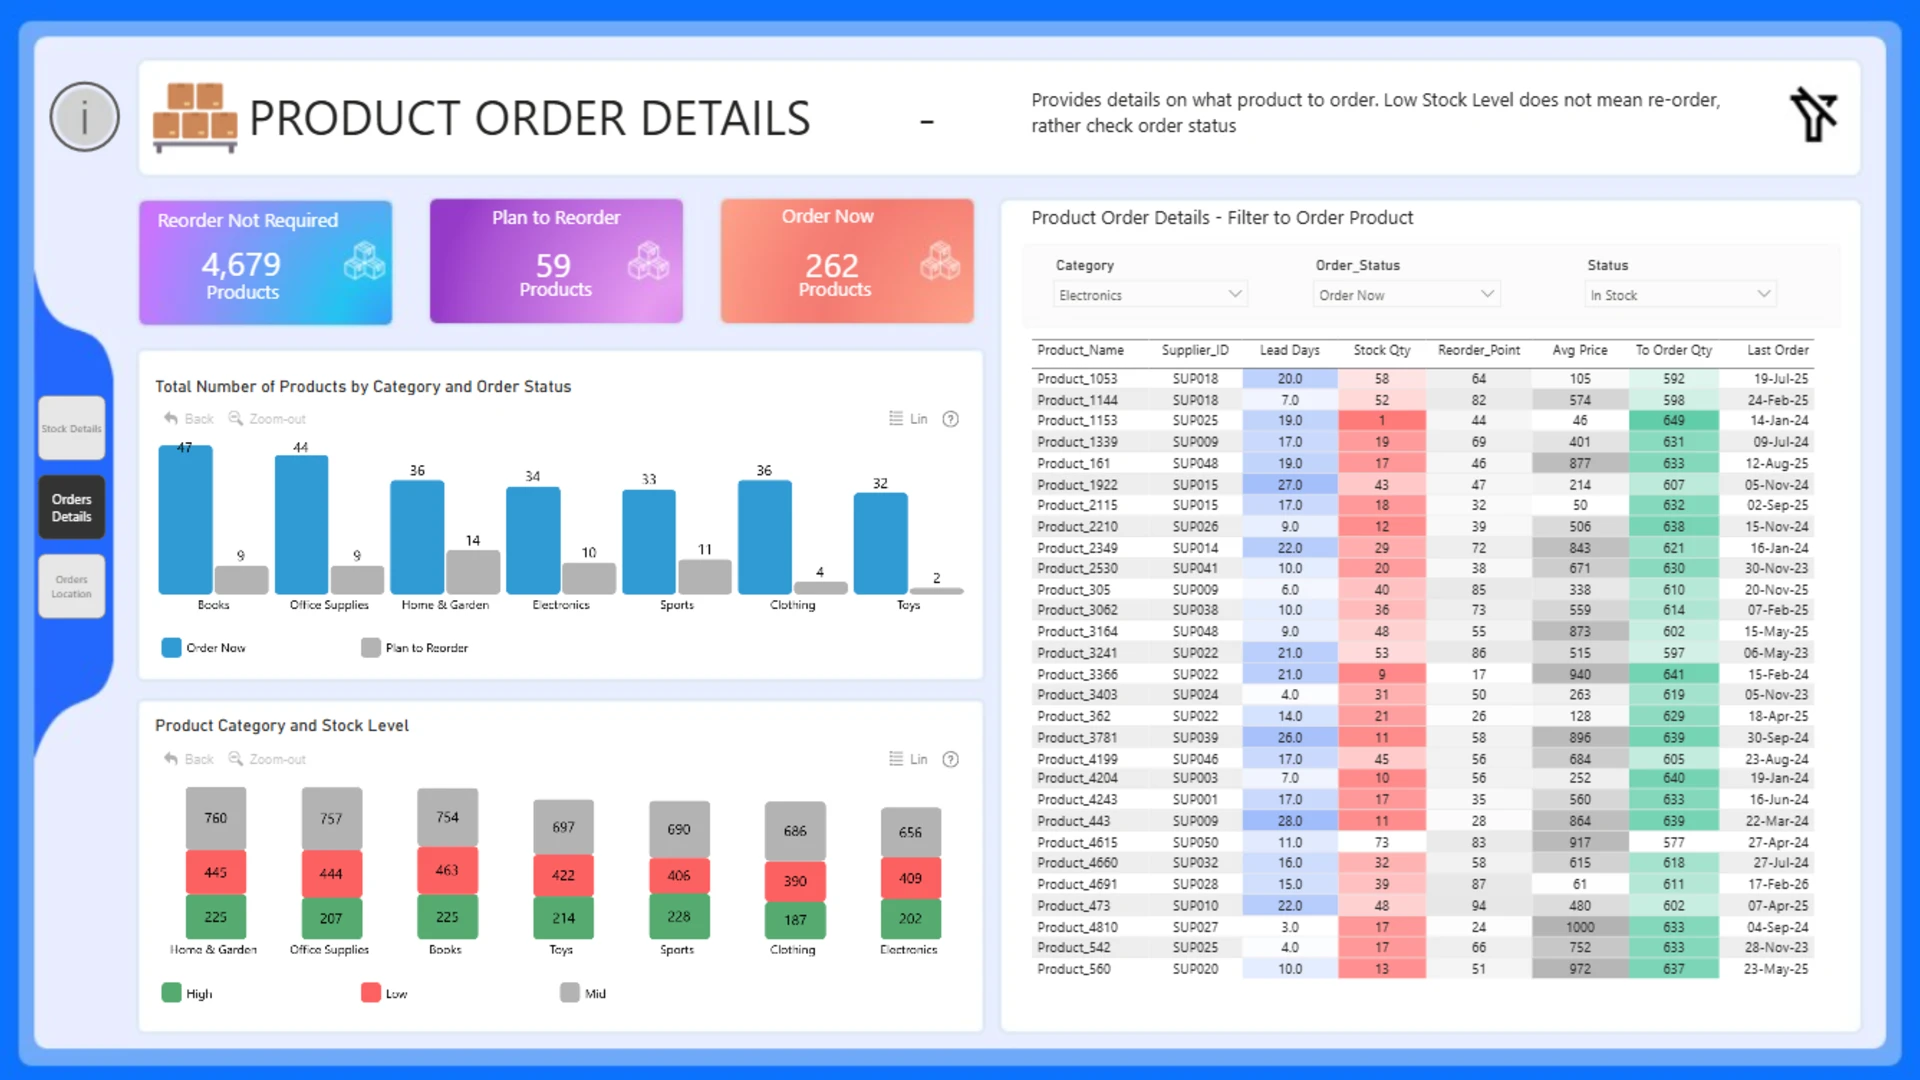
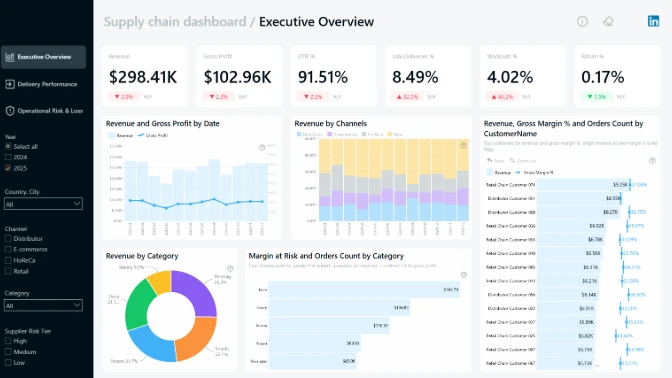
This Power BI inventory management report helps users explore logistics and stock management performance through an interactive business intelligence dashboard. Created by Okeh Dono Efasa, the report uses ZoomCharts visuals to turn inventory data into a more dynamic Power BI example for reviewing processes, locations, and category-level performance.
With Drill Down Combo PRO, Drill Down Map PRO, and Drill Down Donut PRO, the dashboard supports quick comparison, geographic exploration, and intuitive drilldowns across the inventory management process.
Key Insights of Power BI Inventory Management Dashboard
- Analyze inventory and logistics performance from multiple business perspectives.
- Explore process patterns using interactive Power BI custom visuals.
- Compare inventory-related categories and segments with drilldown-enabled charts.
- Review location-based inventory insights through an interactive map view.
- Use the report as a practical Power BI dashboard example for inventory analysis and supply chain reporting.
The report design combines map, combo, and donut visuals to help users move from a high-level overview into more detailed inventory analysis. Interactive filtering and drilldowns make it easier to identify patterns, compare categories, and understand how different parts of the inventory management process connect.
How to Use This Power BI Inventory Management Report
Open the interactive report to explore the inventory dashboard directly in Power BI. Click chart segments, map areas, and visual elements to filter the report and drill into more detailed views. You can also download the .pbix file from ZoomCharts to study the report structure, review how ZoomCharts custom visuals are configured, and adapt the inventory management dashboard approach to your own business data.



4U Report Challenges
Participate in data challenges, build and submit reports to get free template downloads.
Join CommunityMobile view allows you to interact with the report. To Download the template please switch to desktop view.
How to use a PBIX template
Preview the interactive report, download the PBIX file, open it in Power BI Desktop, and replace the same data connection with your own dataset.
Preview and download
Explore the report online and download the PBIX template file.
Open in Power BI Desktop
Open the downloaded PBIX file in Power BI Desktop.
Connect your data
Replace the sample data source with your own dataset.
Refresh and adjust
Refresh the model and update fields or visual were needed.
Save and share
Save your report and publish it for your audience.


