2533
Inventory Management Dashboard 3
Inventory Management Dashboard 3
More Report pages
Report Author: Maria Teresa Cazarin
2533
Share template with others
Report submitted for the FP20 Analytics ZoomCharts Challenge, April 2025. The report was built using the Inventory Management Dataset and includes ZoomCharts custom Drill Down PRO visuals for Power BI.
Author's description:
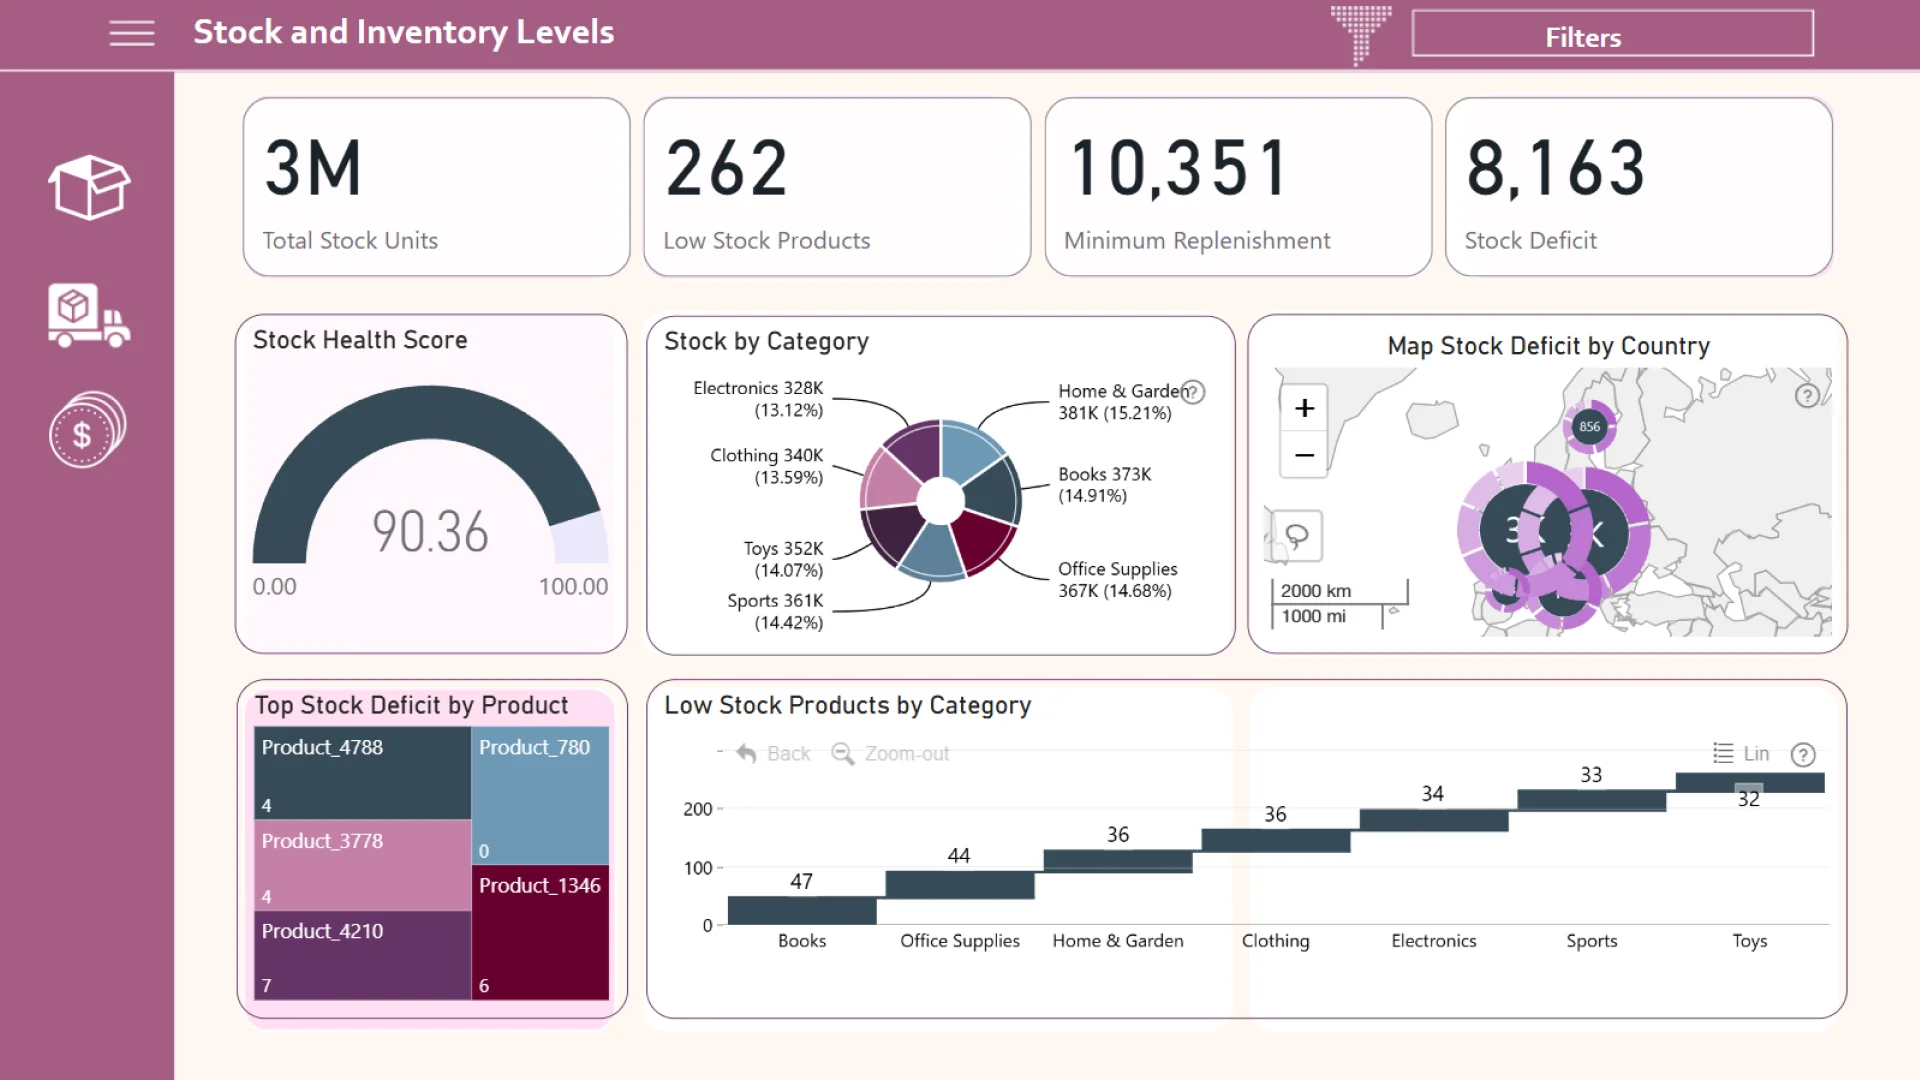
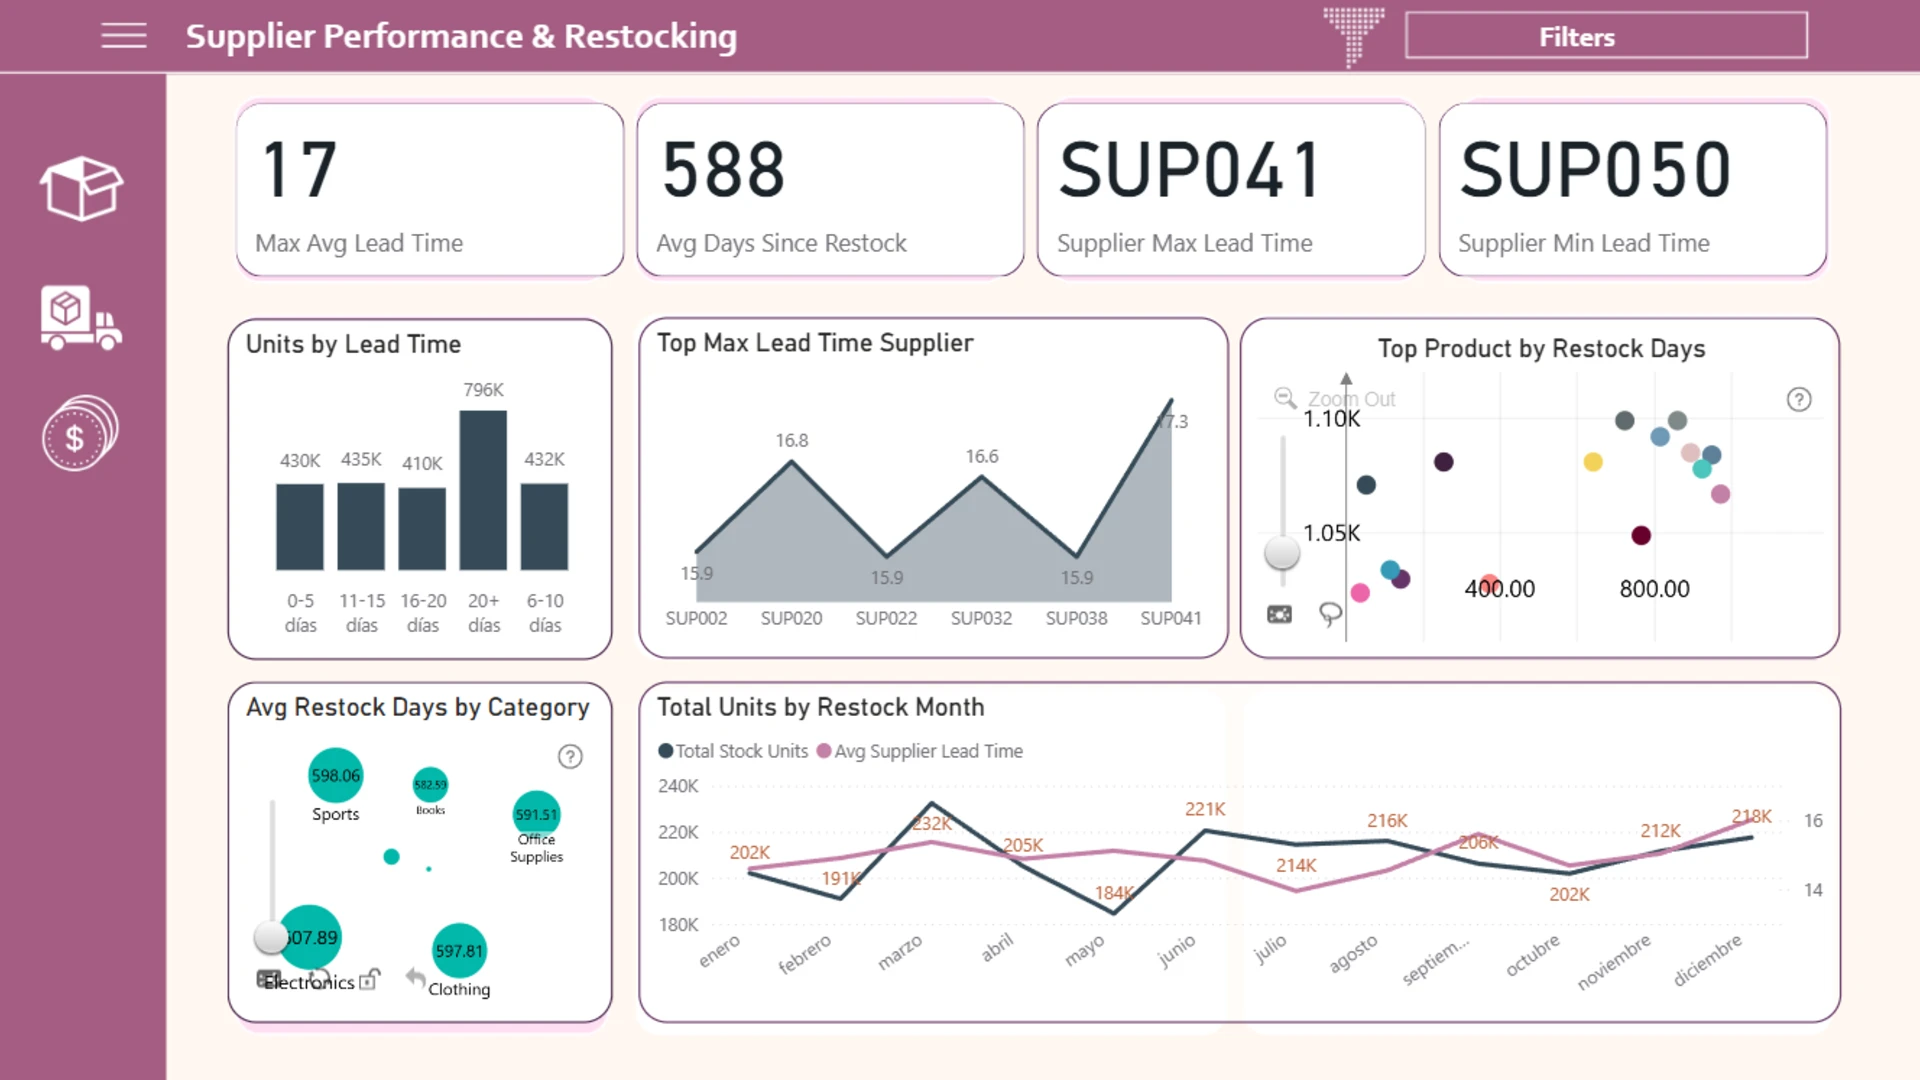
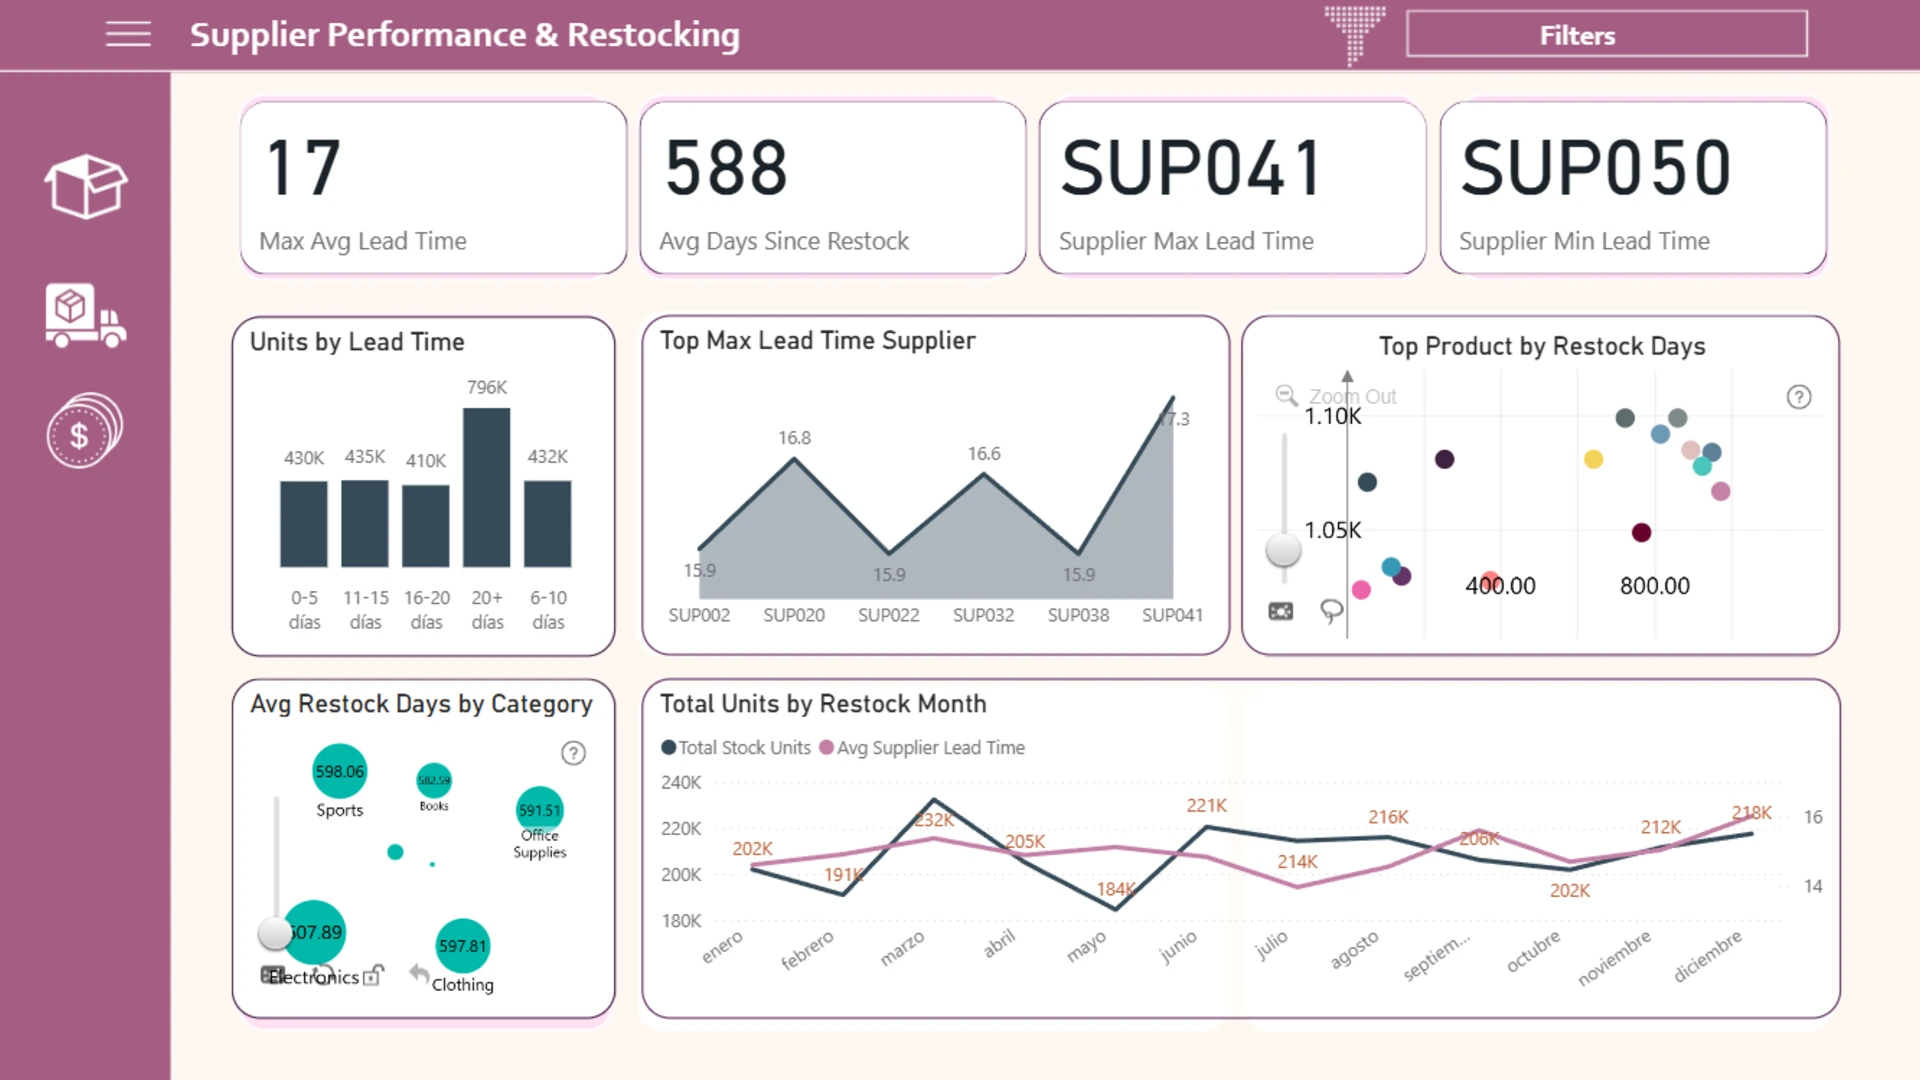
The Inventory Management Dashboard provides a comprehensive view of inventory management with three key sections: Stock and Inventory Levels: Displays the current inventory status, comparing available stock with minimum levels, and highlights out-of-stock or overstocked items, helping optimize rotation and prevent stockouts. Supplier Performance & Restocking: Evaluates supplier performance by analyzing delivery times, order fulfillment, and restocking costs. It helps identify areas for improving supply chain efficiency. Warehouse & Price Analysis: Examines warehouse utilization, order processing times, and product pricing, helping enhance operational efficiency and profitability through margin analysis and supplier pricing comparisons. This interactive dashboard allows for quick, data-driven decision-making to optimize inventory management and improve restocking and storage processes.
ZoomCharts visuals used





4U Report Challenges
Participate in data challenges, build and submit reports to get free template downloads.
Join CommunityMobile view allows you to interact with the report. To Download the template please switch to desktop view.



How to use a PBIX template
Preview the interactive report, download the PBIX file, open it in Power BI Desktop, and replace the same data connection with your own dataset.
Preview and download
Explore the report online and download the PBIX template file.
Open in Power BI Desktop
Open the downloaded PBIX file in Power BI Desktop.
Connect your data
Replace the sample data source with your own dataset.
Refresh and adjust
Refresh the model and update fields or visual were needed.
Save and share
Save your report and publish it for your audience.


