2747
Inventory Management Analysis
Inventory Management Analysis
More Report pages
Report Author: Ugochukwu Nwasuruba
2747
Share template with others
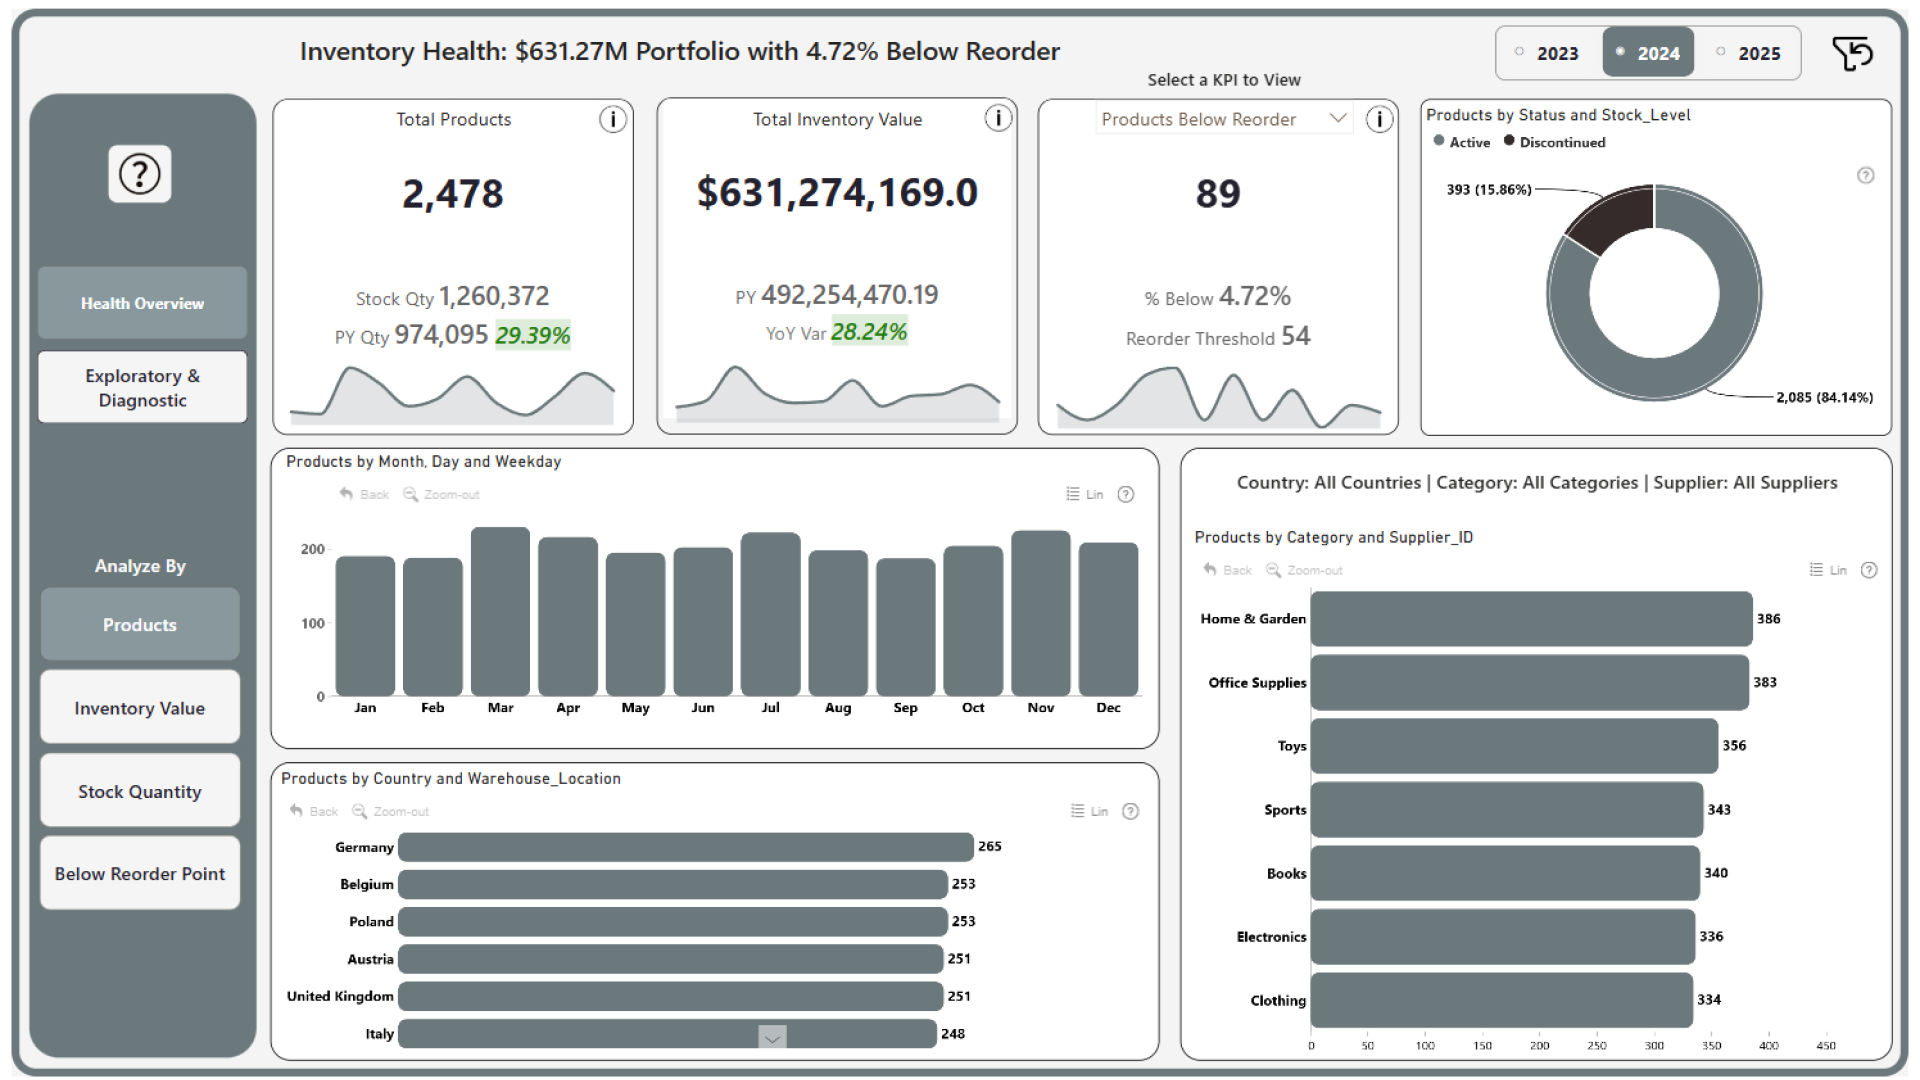
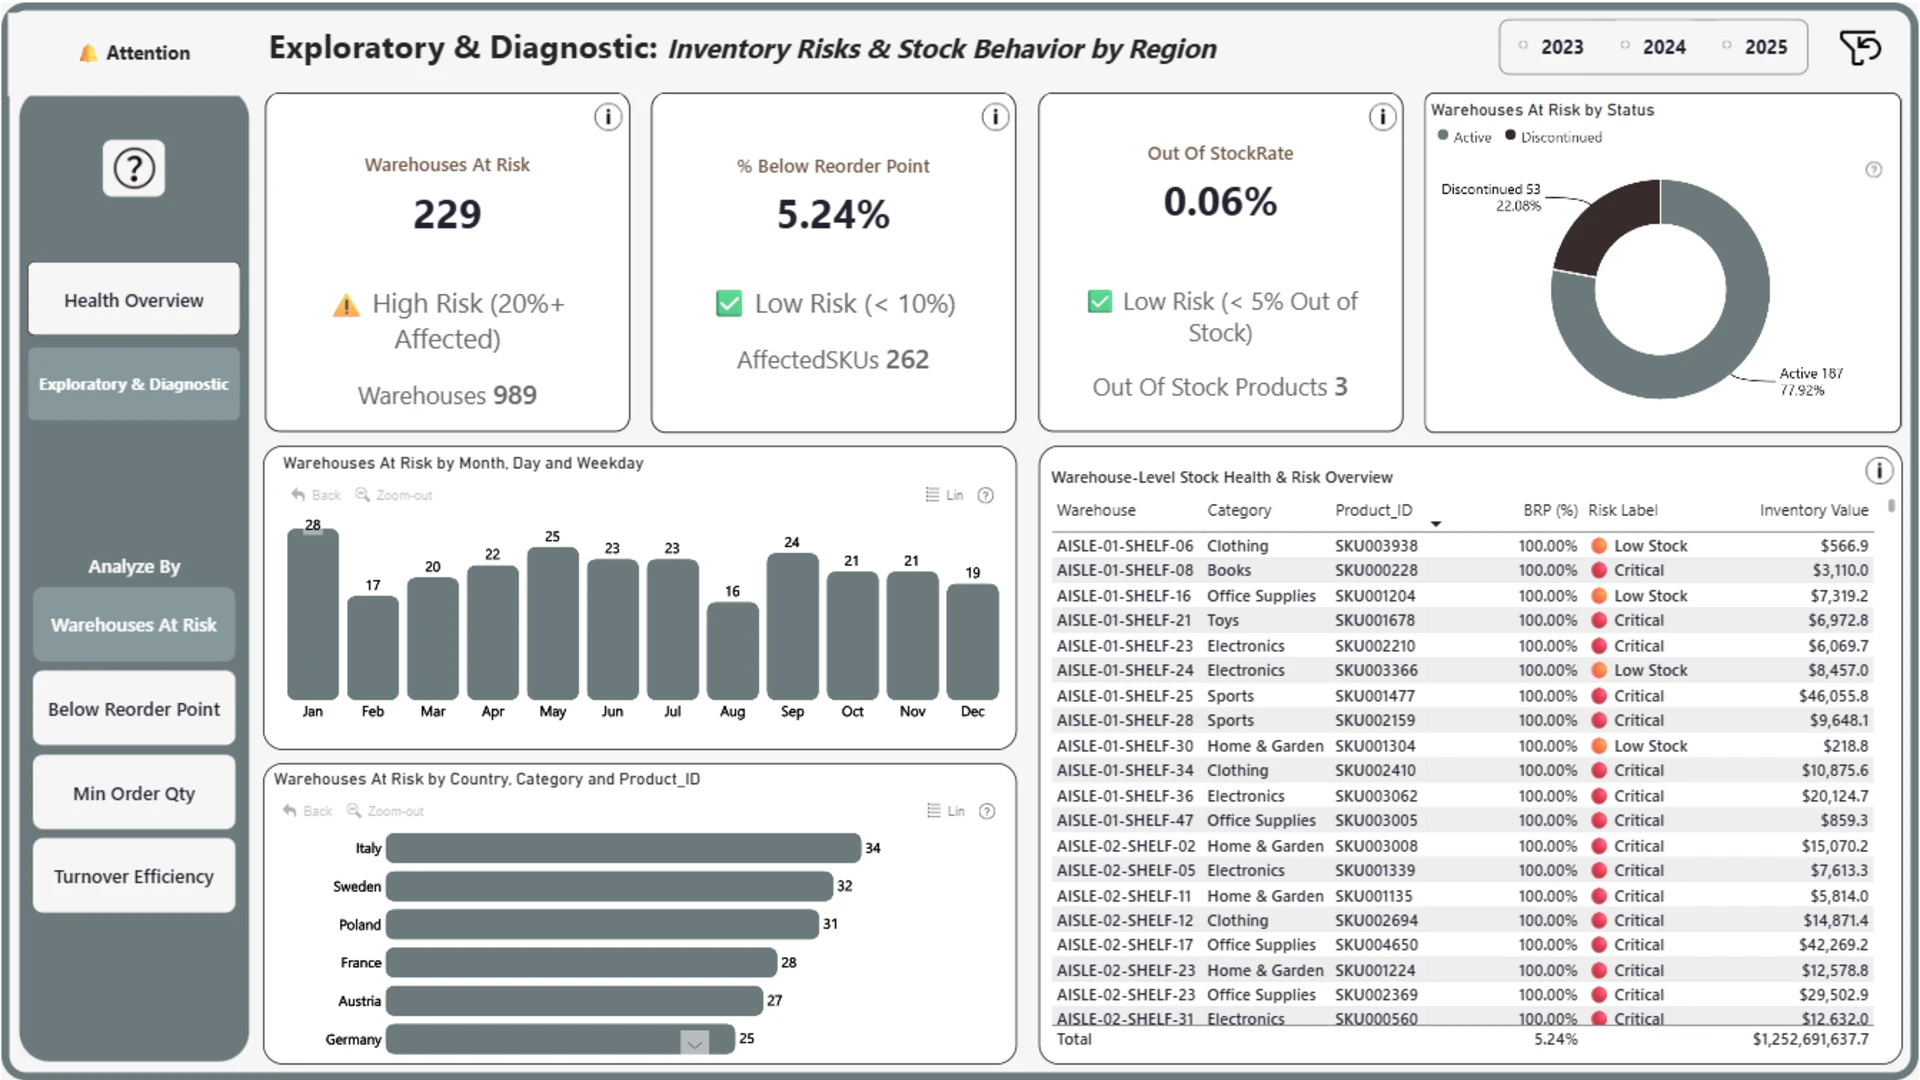
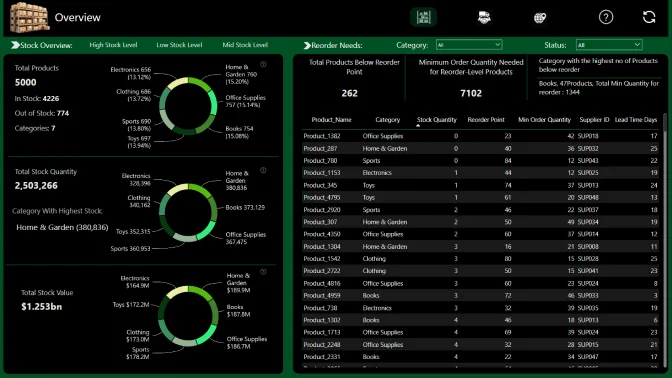
Report submitted for the FP20 Analytics ZoomCharts Challenge, April 2025. The report was built using the Inventory Management Dataset and includes ZoomCharts custom Drill Down PRO visuals for Power BI.
Authors Description:
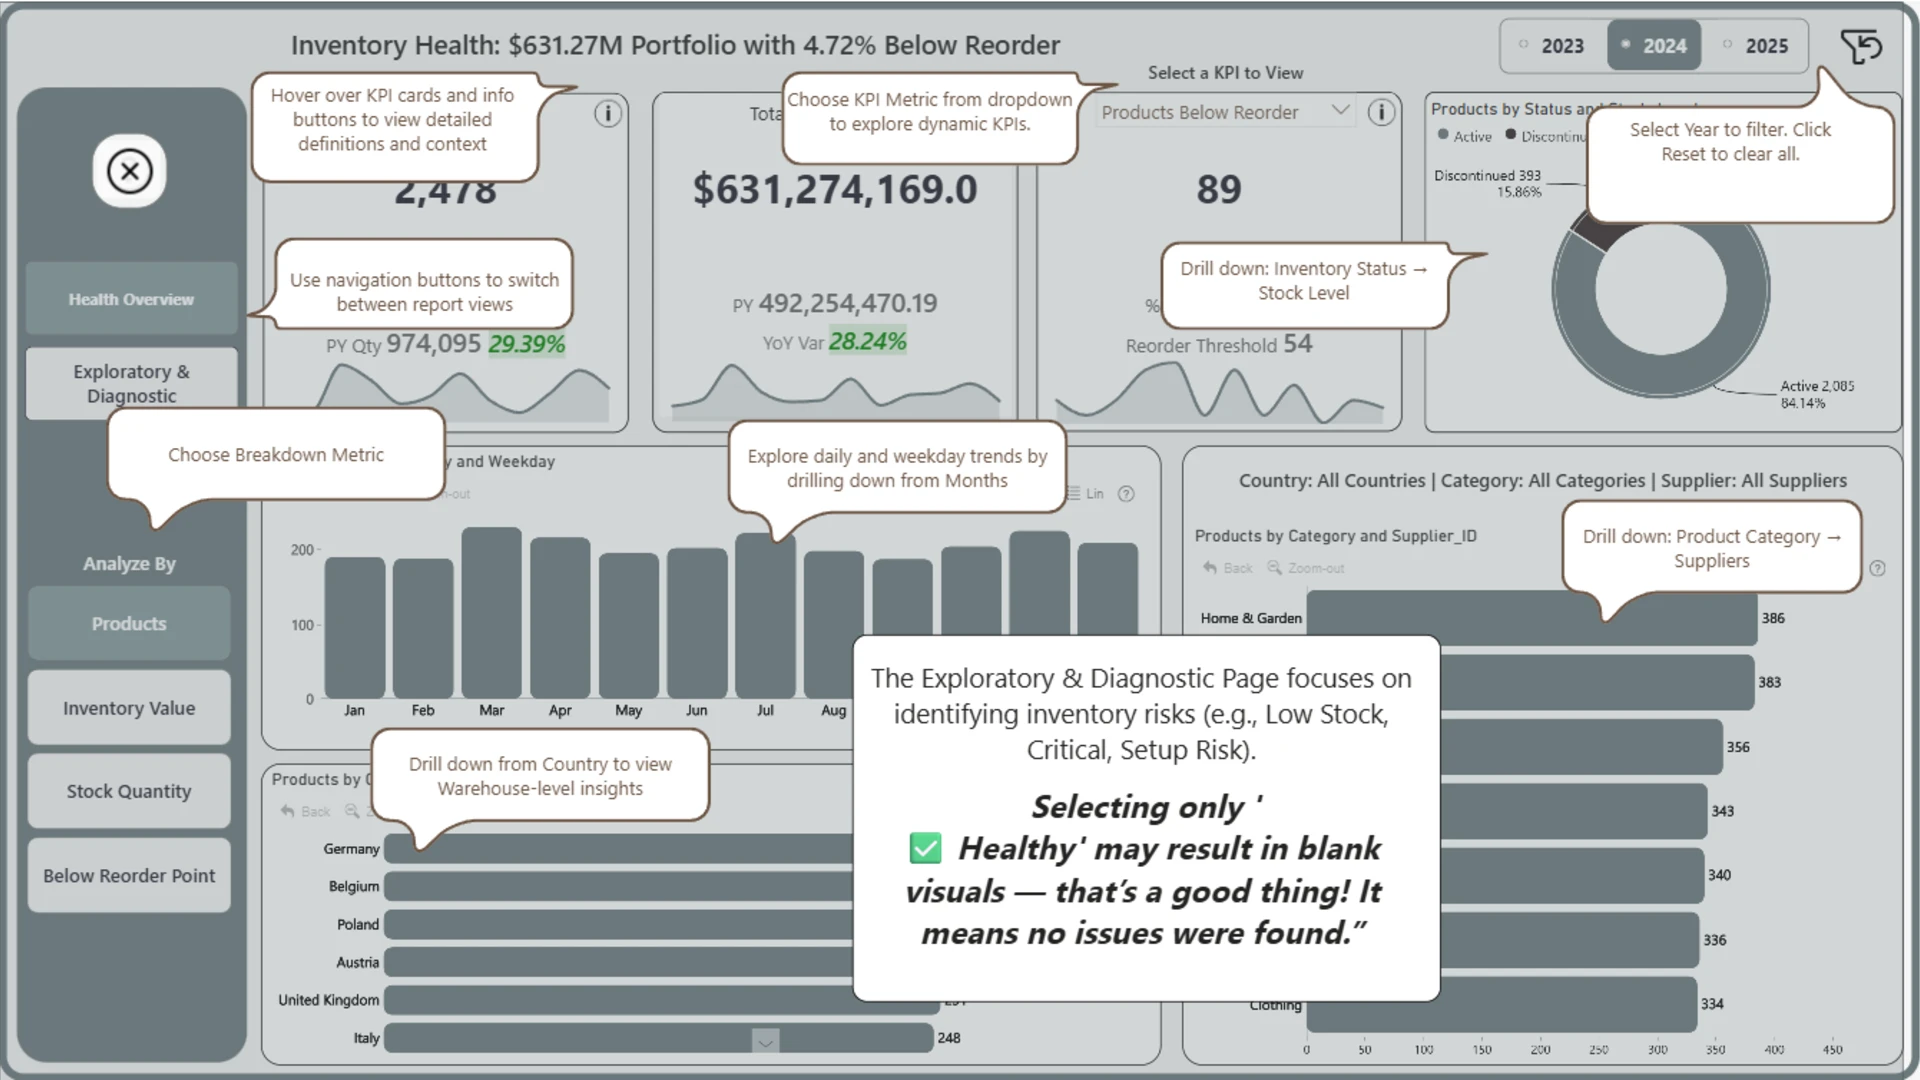
My goal for this report was to build an intuitive, data-driven dashboard that provides executives with a high-level inventory snapshot while enabling managers and analysts to make quick, informed decisions on stock levels and warehouse risks. By leveraging ZoomCharts visuals, field parameter toggles, and interactive filters, the report ensures seamless exploration and real-time insights into inventory performance.
4U Report Challenges
Participate in data challenges, build and submit reports to get free template downloads.
Join CommunityMobile view allows you to interact with the report. To Download the template please switch to desktop view.

Was this helpful? Thank you for your feedback!
Sorry about that.
How can we improve it?